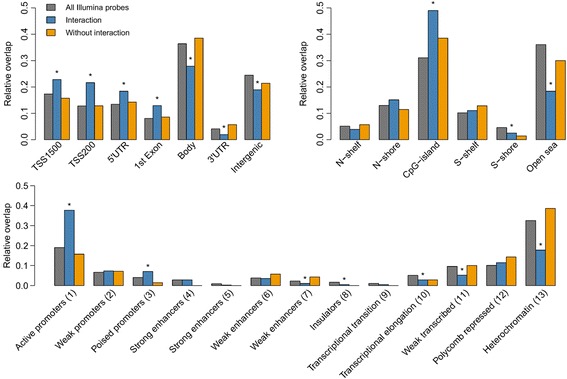
Fig. 4.

Genomic location of sig-DMPs. DMPs were mapped to gene elements (top left), CpG islands (top right), and chromatin state segmentations (bottom). Asterisks indicate significant enrichment or depletion in comparison with all Illumina probes (gray bars) measured by the Fisher’s exact test (P value < 0.05). Sig–DMPs where the interaction term was significant (blue bars) showed an enrichment in promoter regions and CpG islands. Sig-DMPs where no interaction was seen (orange bars) showed no significant enrichment or depletion in a particular genomic region
