
Figure 4.
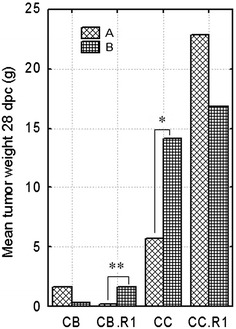
Comparison of tumor size between control and immunized groups of chickens. For statistical analysis, the non-immunized (A) and immunized (B) chickens of all inbred lines (CB, CB.RI, CC and CC.RI) were considered. Chickens of the regressor lines CB, CB.R1 and the progressor lines CC, CC.R1 were challenged with 100 FFU and 20 FFU of the RSV-PR-C respectively (for details see “Materials and methods”). Each column represents an average tumor size in the group of eight chickens (total number 64 chickens). *p < 0.05 non-parametric test (Mann–Whitney); **p < 0.01 both parametric (t test) and non-parametric test (Mann–Whitney).