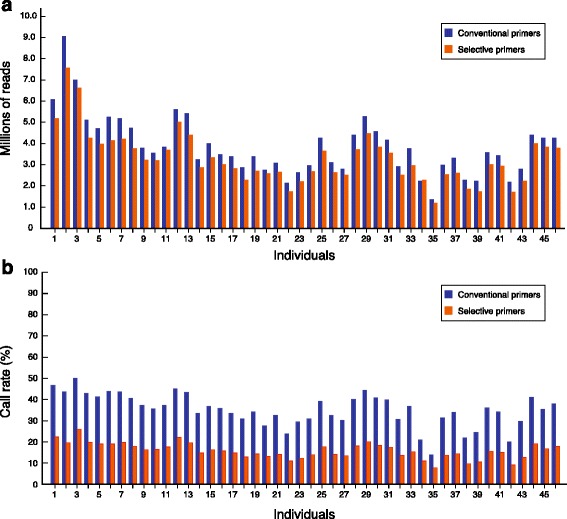
Fig. 3.

Distribution of the number of reads and variant call rates. a Number of mapped reads assigned to individual samples after demultiplexing of two 48 plex sequencing lanes. One group of libraries was prepared with conventional primers, and the other with selective primers. b Call rate of the variants in both methods of library preparation. Variants detected have a minimum read depth of 2 and a genotype quality score of 5 or greater
