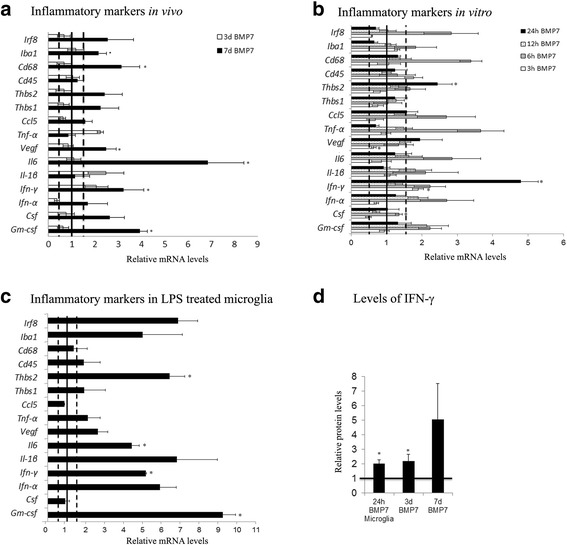
Fig. 2.

BMP7 injection triggers inflammatory changes in the mouse retina. Expression levels of a panel of proinflammatory markers were analyzed by RT-qPCR in RNA samples from mouse retina injected with vehicle or BMP7, harvested 3 and 7 days postinjection (a). At 3 days post-BMP7 injection, about a 2-fold increase in RNA levels, relative to the vehicle controls, was observed in levels of Ifn-γ, Tnf-α, and Il-1β. Seven days post-BMP7 injection, 2-fold increase in levels was observed in Csf, Vegf, Thbs1, and Thbs2, and greater than 3-fold increase in Gm-csf, Ifn-γ, Il6, and CD68 RNA levels relative to the vehicle-injected control. Mouse retinal microglial cells treated with BMP7 for 3, 6, 12, and 24 h were also analyzed for changes in RNA levels of inflammatory markers (b), with LPS treatment used as a positive control (c). In vitro treatments showed a significant increase in Ifn-γ levels at the 3-h time point. At 6 h post-BMP7 treatment, mRNA levels of Gm-csf, Ifn-γ, Csf, Tnfα, Il-6, and Cd68 were increased to 1.5-fold or greater. By 12 h, we observed no significant differences between BMP7 and vehicle-treated samples. At the 24-h time point, however, we observed significant increases in the levels of Ifn-γ and Thbs. The LPS-treated microglia showed a relative increase in most of the markers, with significant increases observed in levels of Gm-csf, Ifn-γ, Il-6, and Thbs2 (c). Protein levels of IFN-γ was also determined via ELISA (d). We observed a 2-fold increase in levels in medium from microglial cells incubated with BMP7 for 24 h and in protein from whole retinal tissue from mice injected with BMP7 for 3 days, when compared to their respective vehicle control. Protein from 7 days BMP7-injected retina showed a 5-fold increase in protein levels compared to the vehicle control. Data shown in graphs represent relative expression levels of RNA or protein of BMP7 or LPS-treated samples to their respective vehicle control. Bars above a level of 1.0 (solid black line) represent an increase in mRNA levels while bars below the level of 1.0 represent a decrease in mRNA levels relative to the corresponding vehicle control. Statistical analysis was performed by unpaired Student’s t test. *p value <0.05. Abbreviations: CD cluster of differentiation, Csf colony stimulating factor, Gm-csf granulocyte macrophage colony stimulating factor, Ifn interferon, Il interleukin, Tnf-α tumor necrosis factor alpha, Thbs thrombospondin, Vegf vascular endothelial growth factor
