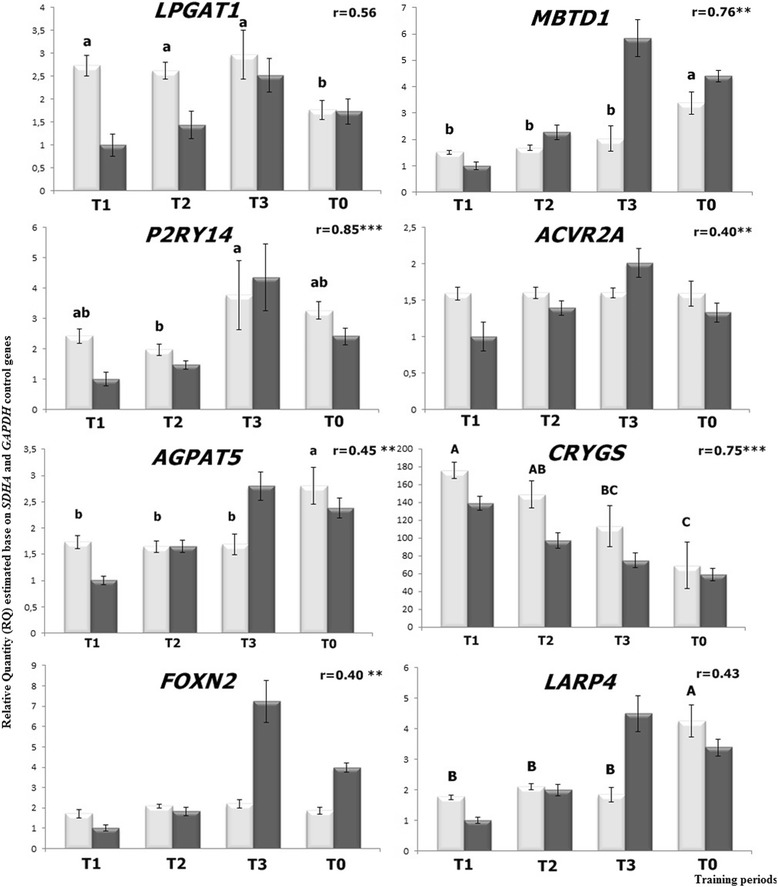
Fig. 3.

The exact gene expression levels estimated by real-time PCR (white column) and normalized counts detected by RNA-seq (grey column) for selected genes. The data are presented as mean ± standard error (training periods are T1: after the slow canter phase, T2: after the intense gallop phase, T3: at the end of the racing season; and T0 are untrained horses; the mean of Relative Quantity with different letters vary in significance with a,b: p < 0.05 and A,B: p < 0.01; r: correlation coefficient; * p < 0.05; ** p < 0.01; ***p < 0.001)
