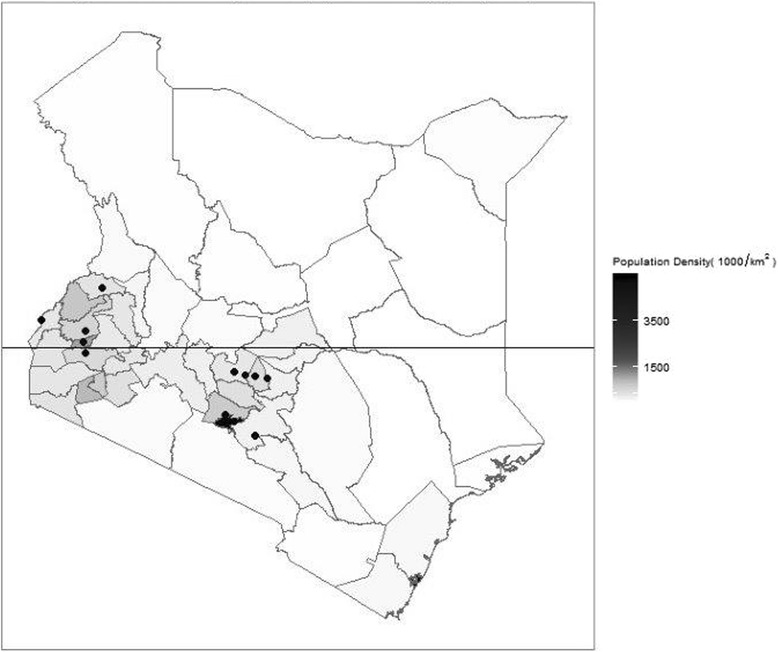
Fig. 1.

Geographic location of hospitals. Black dots represent hospitals in the clinical information network and included in the analysis while the black lines represent county boundaries. Hospitals are clustered in the central and western regions consistent with where the majority of the Kenyan population lives
