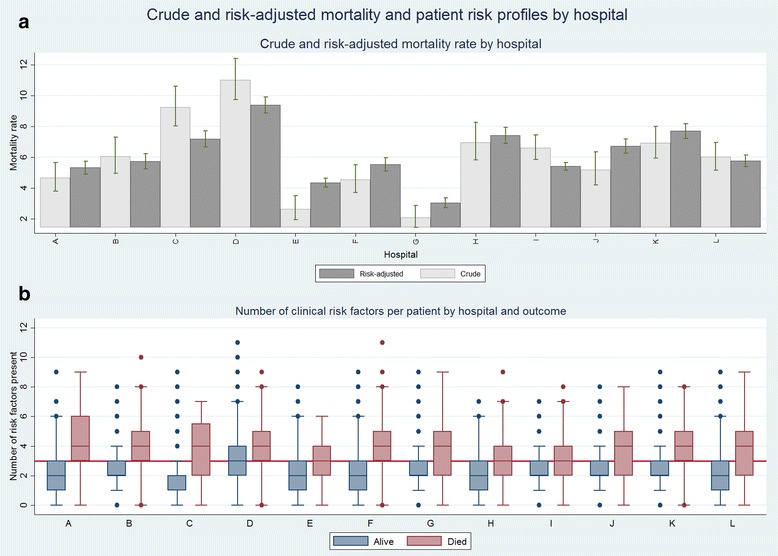
Fig. 3.

Crude and risk-adjusted mortality and patient risk profiles by hospital. The top panel Fig. 3a represent crude (light grey) and risk-adjusted mortality rate (dark grey) across hospitals with accompanying 95% confidence intervals. The bottom panel Fig. 3b represent the median and the 25th and 75th interquartile ranges for number of risk factors per patient stratified by mortality. Hospitals are ordered by malaria endemicity (low A, B, C, D, E, F, G; high H, I, J, K, L)
