
Fig. 1.
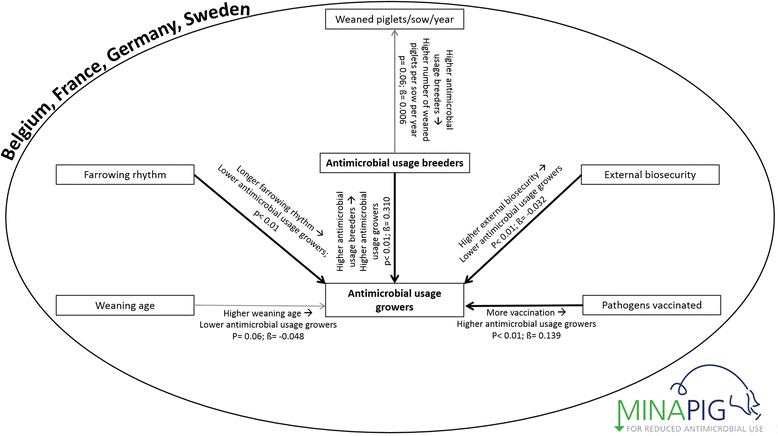
Causal pathway associations for TI 200 days and TI Breeding. Causal pathway with statistically significant associations in the multivariable models for the TI 200 days and the TI Breeding associated with production, management or biosecurity variables. TI = treatment incidence (antimicrobial usage quantification), WSY = number of weaned piglets per sow per year. Black lines represent the result of a multivariable linear regression analysis based on data from 4 EU countries. The light gray line indicates 0.05 < p < 0.10. The p-values and β-values correspond to the multivariable model. All models were corrected for the country effect by placing country as a fixed variable in the model, hence the circle around the figure