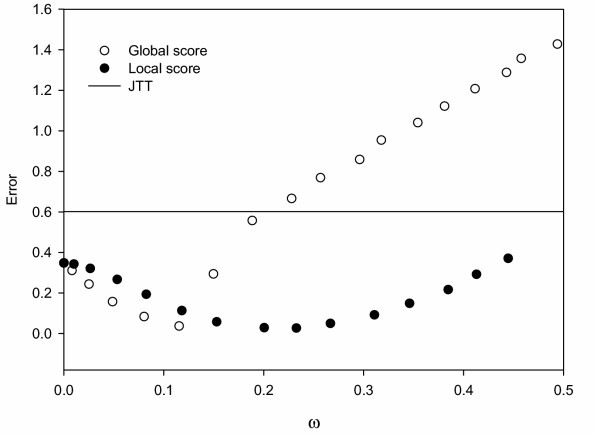
Figure 5.
Error in entropy profiles between observed and equilibrium SCPE amino acid probability distributions versus calculated acceptance rate. Results for local-score and global-score SCPE simulations are shown, together with those obtained from JTT simulations of 0.28 amino acid substitutions per site.

