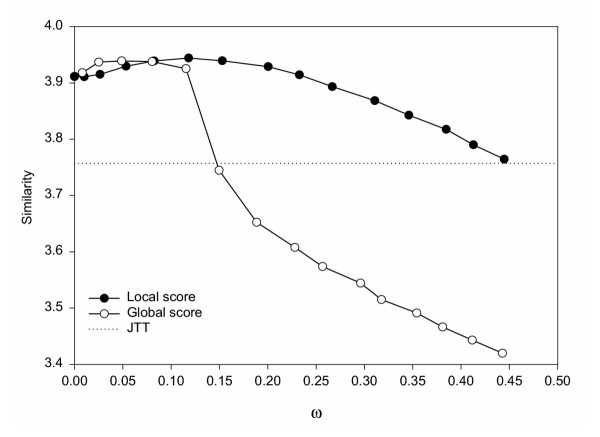
Figure 6.
Similarity score between observed and equilibrium SCPE amino acid probability distributions versus calculated acceptance rate. Results for local-score and global-score SCPE simulations are shown, together with those obtained from JTT simulations of 0.28 amino acid substitutions per site. For ω = 0, the distribution is that obtained from the ancestral sequence, LPXA of Ecoli by grouping sites of the same class, since in this case no substitution is accepted and therefore it is impossible to obtain the SCPE substitution matrices. For SCPE we used equilibrium distributions, which do not depend on time. JTT results become worse for longer times (Ka>0.28).

