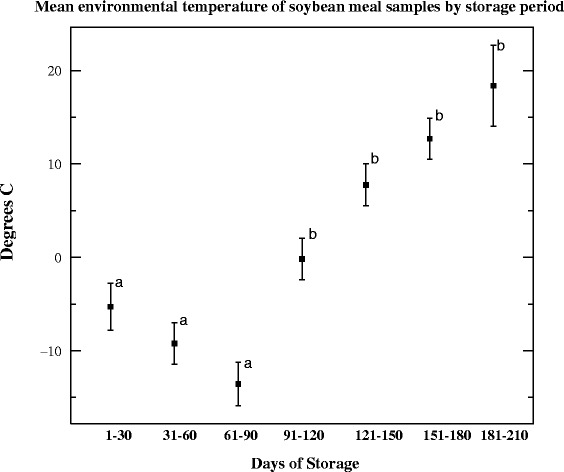
Fig. 3.

Mean environmental temperatures of soybean meal samples by storage period. This figure displays the mean and the 95 % confidence intervals associated with the project period (day 1–30 PI) and the 180 day supplementary testing period of soybean meal (SBM). Note the significant increase in mean temperature observed days 1–90 PI and days 91–210 PI. During the 210 day period, viral titers decreased (1–30 DPI), stabilized (31–150 DPI) then decreased in accordance with increasing temperature (151–180 DPI)
