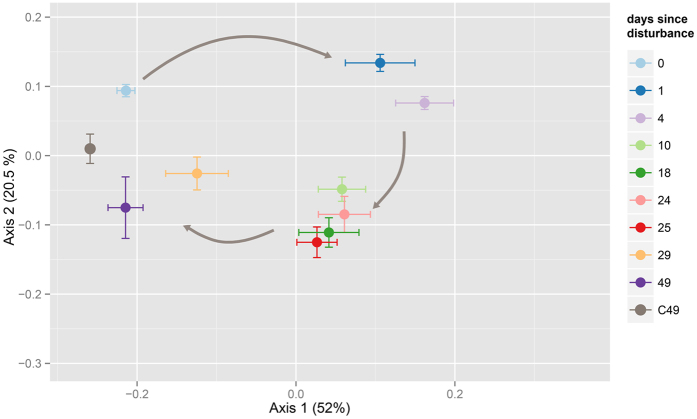
Figure 3. Variation in the community diversity during succession.
A PCoA plot of weighted Unifrac distances between samples showed the strong effect of disturbance, and the temporally clustered pattern of recovery. Clusters were determined with a pairwise PERMANOVA p < 0.01. Centroids for each sampling time are shown along with their standard errors (error bars), and temporal dynamics are indicated with grey arrows.

