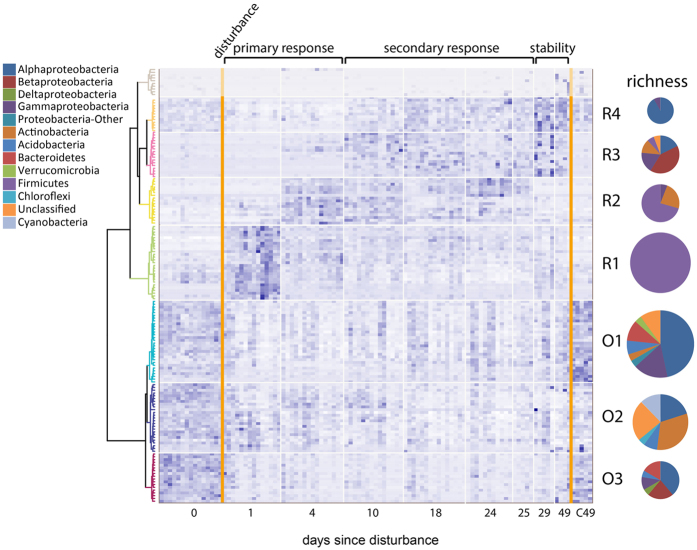
Figure 5. Temporal dynamics of bacterial OTU clusters along secondary succession.
156 OTUs which varied significantly in time were taken into account. Intensity of blue color indicates the relative abundance of each OTU. Phylum/subphylum membership (richness) within each group are shown in pie charts; pie chart size is scaled to the number of taxa represented in each group. Further details about each group are provided in Supplementary Information S4 and S5. The top cluster (grey) is composed of lowly abundant OTUs.

