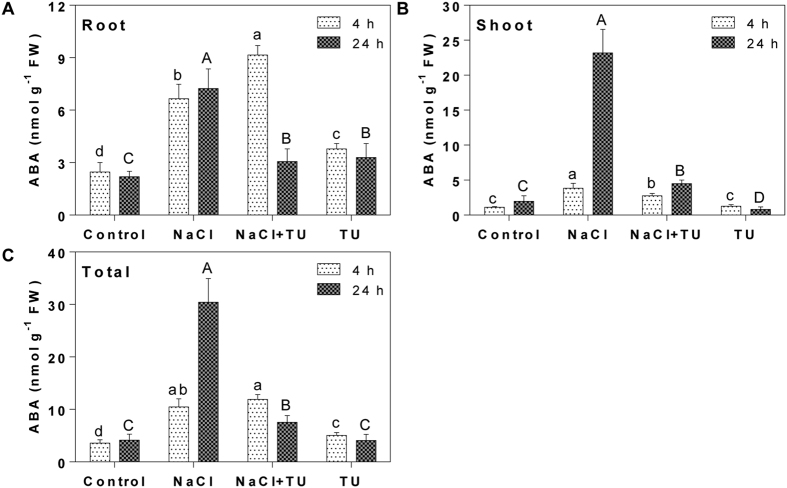
Figure 4. ABA quantification in B. juncea seedlings under different treatments.
The 15 d old hydroponically grown seedlings were given different treatments such as control (1/2 MS), NaCl (125 mM), NaCl (125 mM) + TU (75 μM) and TU (75 μM) and ABA was quantified at 4 and 24 h after treatment independently in root (A) and shoot (B). The whole plants ABA represent the sum of root and shoot (C). For NaCl + TU and TU alone treatments, 24 h pre-treatment with same concentration of TU was also given. The data represents the mean ± SE of three biological replicates. Different letters on bar graph have been put on the basis of LSD value derived from SPSS software (DMRT, P < 0.05). Small and capital case letter is used for 4 and 24 h, respectively.

