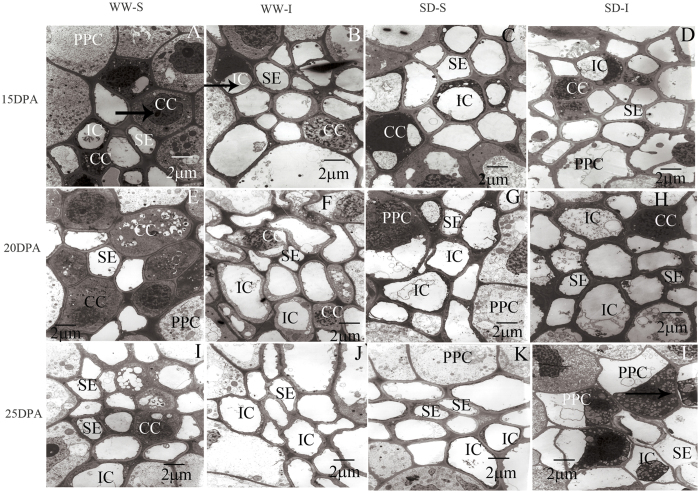
Figure 5. Transmission electron micrographs showing abdominal phloem tissue ultrastructure during wheat caryopsis in response to water deficit at different stages.
WW, well-watered; SD, severe water deficit; S, superior grains; I, inferior grains; DPA, days post-anthesis; SEs, sieve elements; CCs, companion cells; ICs, intermediary cells; PPC, phloem parenchyma cells. (A), CCs with prominent nuclei (arrow) distributed in dense cytoplasm; (B), protoplasm (arrow) of ICs was distributed in the cell cavity; L, PPC (arrow) showed plasmolysis and nuclear chromatin condensation.

