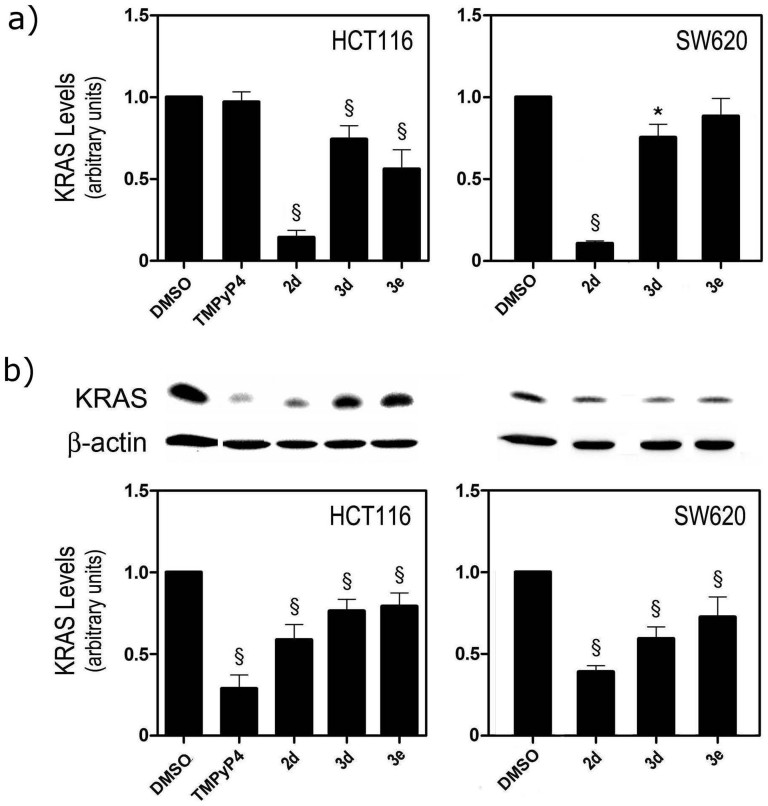
Figure 6. KRAS mRNA and protein steady-state expression after exposure of HCT116 and SW620 cells lines to equitoxic (IC50) concentrations of compounds TMPyP4, 2d, 3d and 3e for 72 h.
(a) KRAS mRNA steady-state expression was evaluated by Taqman Real-time RT-PCR using specific Taqman Assays for KRAS and β-Actin for normalization. KRAS mRNA steady-state expression levels were calculated by the ΔΔCt method, using DMSO (vehicle control) for calibration; and (b) KRAS protein steady-state expression evaluated by immunoblot relative to control (DMSO vehicle) Results are expressed as mean ± SEM of at least three independent experiments; *p < 0.05 and §p < 0.01 from DMSO (vehicle control).

