Figure 3.
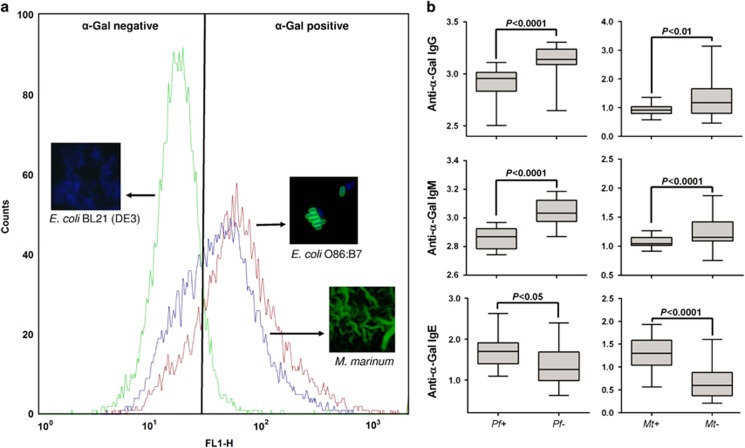
Correlation between anti-α-Gal antibodies and protection against malaria and tuberculosis. (a) Flow cytometry and immunofluorescence showing the presence of α-Gal on the surface of mycobacteria (Mycobacterium marinum CECT 7091 reference strain). Escherichia coli O86:B7 (ATCC 12701) and BL21 (DE3) strains were included as positive and negative controls for α-Gal, respectively. For flow cytometry, cells were stained with BSI-IB4-FITC to visualize α-Gal and the viable cell population was gated according to forward scatter and side scatter parameters. Ten microliters of the fixed and stained samples were also used for immunofluorescence assays after air-drying and mounted in ProLong Antifade reagent containing DAPI. Representative immunofluorescence images are shown for bacterial cells stained with BSI-IB4-FITC (anti-α-Gal-FITC, green; blue, DAPI). (b) Anti-α-Gal antibody titers in patients with malaria or tuberculosis and healthy individuals. The levels of anti-α-Gal IgM and IgG antibodies were significantly higher in P. falciparum uninfected (Pf−) vs infected (Pf+) individuals from Senegal. A similar pattern was observed in M. tuberculosis uninfected (Mt−) vs infected (Mt+) individuals from the Iberian Peninsula. The levels of anti-α-Gal IgE antibodies were lower in both Mt+ and Pf+ patients, when compared with Mt− and Pf− healthy individuals, respectively. The nonparametric Mann–Whitney U-test was used to compare values between infected and uninfected groups (P=0.05).

