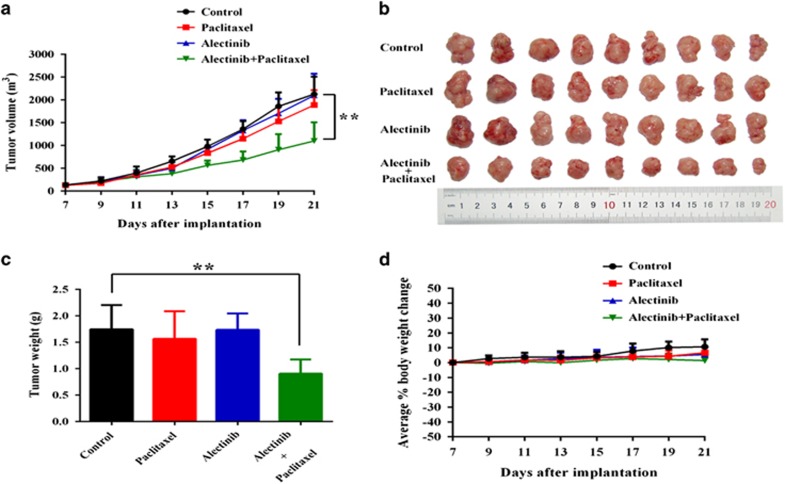
Figure 2.
Potentiation of the anticancer effects of paclitaxel by alectinib in the KBv200 cell xenograft nude mice model. The tumor growth curve was drawn to monitor the tumor volume with time after implantation. The data shown are expressed as the mean±s.d. of the tumor volume for each group (n=9) (a). The tumor xenografts were excised, and the tumors were photographed on the 21st day after implantation (b). The body weights of the experimental animals were measured every 2 days, and the average percentage change was calculated after treatment (c). The average tumor weight of each group was calculated after the tumors were excised from the mice (d). The data are shown as the mean±s.d. for each group, **P<0.01.

