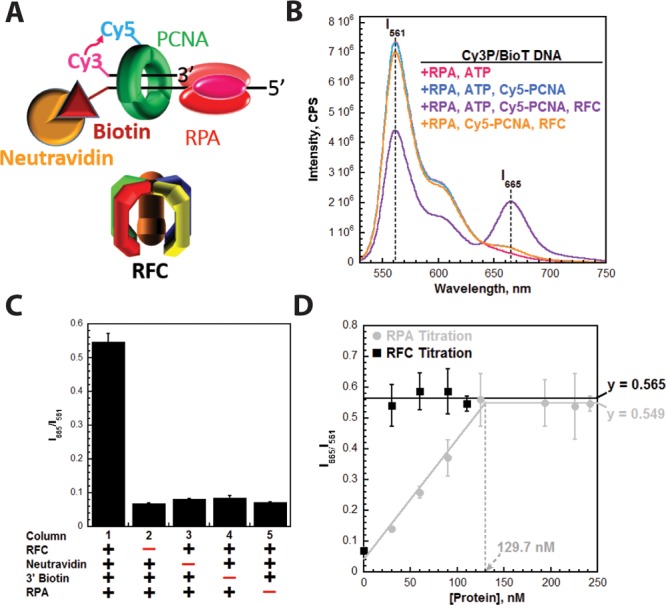
Figure 2.

Monitoring the retention of PCNA on DNA through FRET. (A) Schematic representation of PCNA encircling a P/T junction bound by RPA. When loaded onto P/T DNA by RFC, the Cy5 FRET acceptor on PCNA faces the Cy3 FRET donor on the P/T DNA. (B) Fluorescence emission spectra in the presence of RPA. Cy3P/BioT DNA (100 nM), Neutravidin (400 nM), ATP (1 mM), and RPA (242 nM) were pre-equilibrated at 25 °C. Cy5-PCNA (110 nM homotrimer) and RFC (110 nM) were sequentially added; the solution was excited at 514 nm, and the fluorescence emission spectrum was recorded from 530 to 750 nm. The fluorescence emission intensities at 665 nm (Cy5 FRET acceptor fluorescence emission maximum, I665) and 561 nm (Cy3 FRET donor fluorescence emission maximum, I561) are indicated. Cy5-PCNA can be excited through FRET from Cy3P/BioT only when the two dyes are in close proximity of each other (less than ∼10 nm). This is indicated by an increase in I665 and a concomitant decrease in I561. (C) Characterization of the steady state FRET signal. Cy5-PCNA was assembled onto the Cy3P/BioT DNA substrate as in panel A with various components omitted, and the FRET signal (I665/I561) was measured. As a control, RFC was omitted (column 2). (D) Titrations of the steady state FRET signal. The Cy3P/BioT DNA substrate (100 nM with 400 nM Neutravidin) was either saturated with RFC (110 nM) and titrated with RPA (0–242 nM) (●) or saturated with RPA (242 nM) and titrated with RFC (30–110 nM) (■). Results are plotted vs the concentration of the respective titrant. When RPA was titrated, the FRET signal increased linearly and then plateaued. At the break point, the concentration of RPA (129.7 nM) is roughly equivalent to the concentration of RPA binding sites within the assay (120 nM). When RFC was titrated, the FRET signal remained constant at a level (0.565) equivalent to that observed at saturating concentrations of RFC and RPA (0.549).
