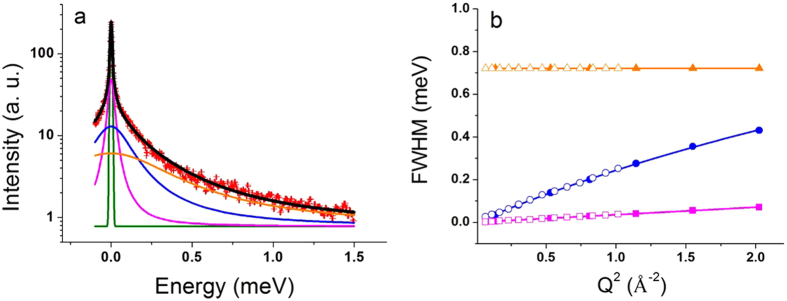
Figure 2. QENS data and fits. Logarithmic plot of a typical QENS spectrum (IN5) of N-LDL at 310 K and 20 bar measured at Q = 1.00 Å−1 (red points) and quasi-elastic contributions determined by the fit: the green line corresponds to the elastic contribution, the magenta, blue and orange lines to Lorentzian functions.
The black line shows the final fit (a); FWHM values of the three Lorentzian distributions as function of Q2 obtained from IN5 (smaller Q-range, open symbols) and IN6 (full symbols) and their fits according to a translational diffusive model (magenta points), a jump-diffusion model (blue points) and a rotational diffusive model (orange points) (b).

