
Figure 5.
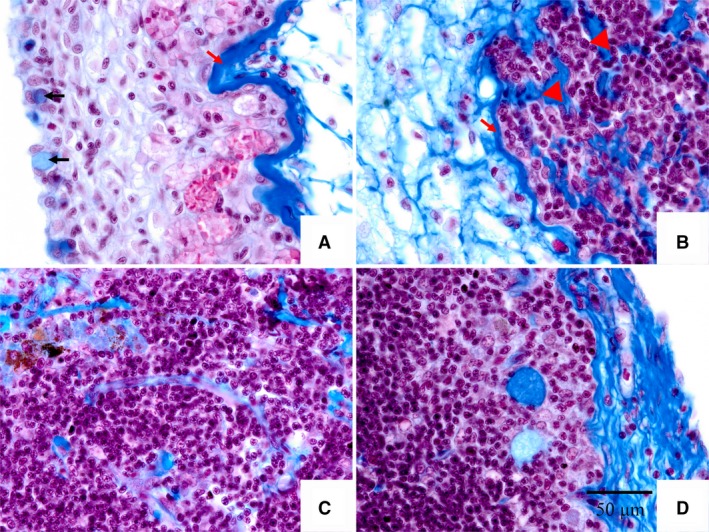
Masson's staining of thymus section at 6 months post‐fertilization. Image A shows the stratum L.a in Fig. 4. Image B shows the boundary between stratum L.c and L.d. Images (C, D) show the centre zone of the tilapia thymus. Black arrow in image A indicates myxocyte. Red arrow in images (A, B) indicates dense connective tissue. Red triangle in image B indicates collagenous fibers invading the thymus. Scale bar: all images as shown in (D).