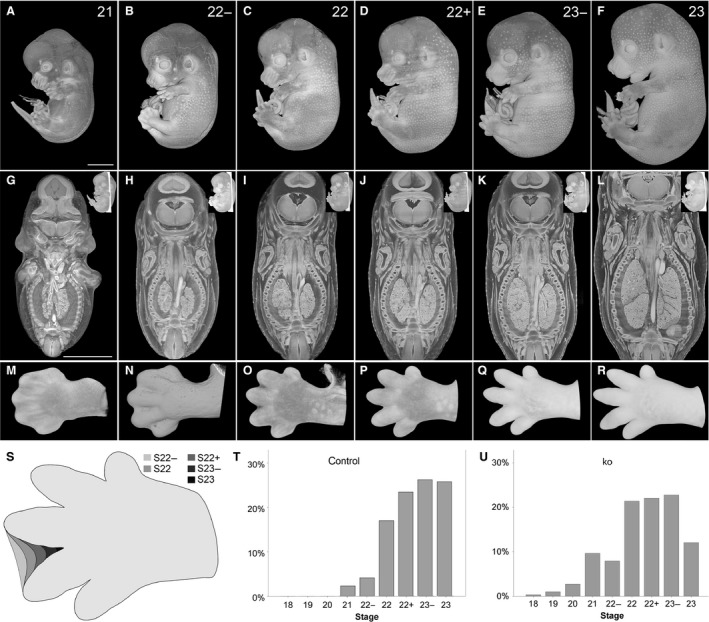
Figure 2.

Stages of E14.5 embryos. (A–F) Volume‐rendered 3D models of the surface showing stages (S) 21–23. (G–L) Appearance of internal structures in coronal sections through the 3D models. (M–R) Volume‐rendered 3D model of hands of embryos classified as S21–S23. All models are set in their original, stage‐dependent size relations. (S) Scheme of development of interdigital space between 3rd and 4th digit from S22− to S23. (T,U) Stages distribution of DMDD control (n = 215) (T) and knock‐out embryos (n = 297) (U). Scale bars: 2 mm.
