
Figure 5.
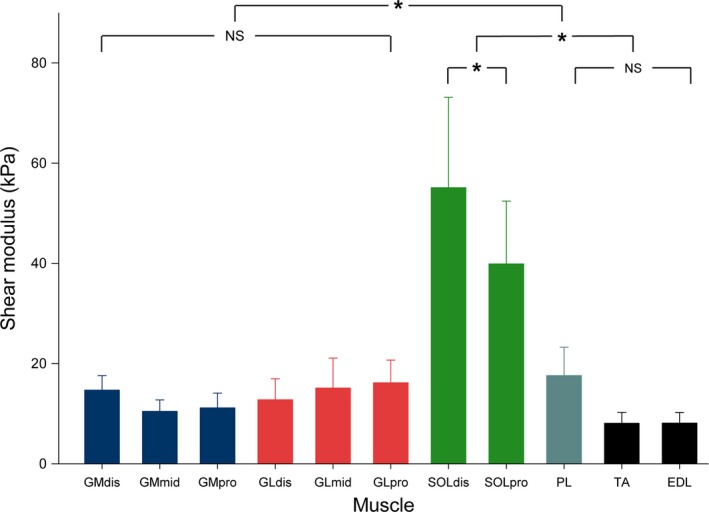
Histogram of mean shear values for each muscle, at 80% of maximal range of motion (experiment 2, knee flexed). Repeated measure anova with P < 0.05 followed by Bonferroni post‐test. Data are shown as mean values ± standard deviation. *P < 0.001; NS: non‐significant at P < 0.05. GM: gastrocnemius medialis; GL: gastrocnemius lateralis; SOL: soleus; PL: peroneus longus; TA: tibial anterior; EDL: extensor digitorum longus. dis: distal‐leg transducer location; mid: mid‐leg transducer location; pro: proximal‐leg transducer location.