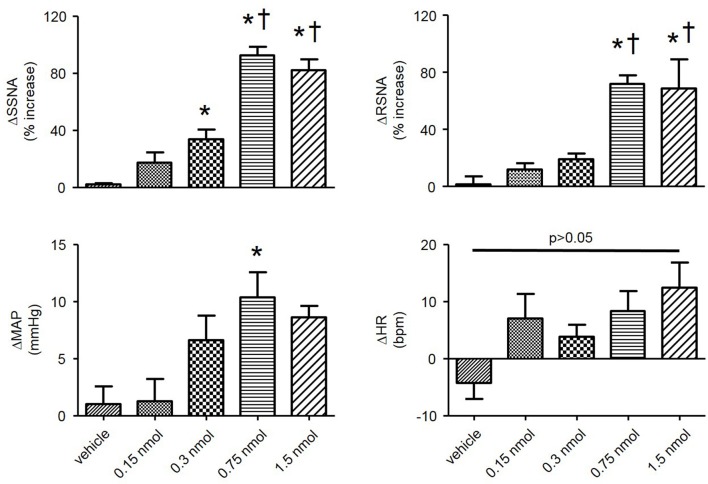
Figure 2.
Summary data showing changes in SSNA, RSNA, mean arterial pressure (MAP), and heart rate (HR) in response to bilateral microinjections of varying doses of TG (vehicle, n = 3; 0.15 nmol, n = 4; 0.3 nmol, n = 5; 0.75 nmol, n = 6; 1.5 nmol, n = 5) into the PVN. *P < 0.05 vs. vehicle; †P < 0.05 vs. 0.3 nmol (1-way ANOVA Newman-Keuls multiple-comparison test).

