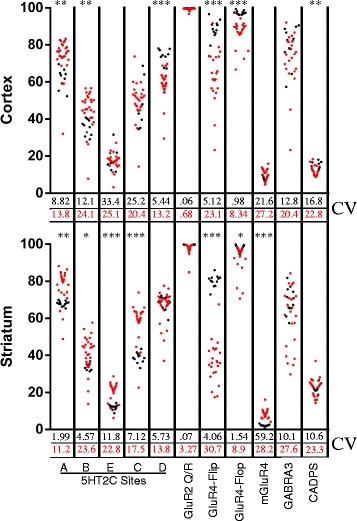
Fig. 1.

A-to-I editing in brain tissue from individual humans and rhesus macaques. Each red dot represents data from a single human sample and each black dot represents data from a rhesus macaque sample. The extent of editing is indicated on the Y-axis and the numbers below each column represent coefficient of variation for each species represented in the corresponding color. t-tests were used to compare the differences in the mean extent editing between the two species. (*p < .01 **p < .001 ***p < .0001)
