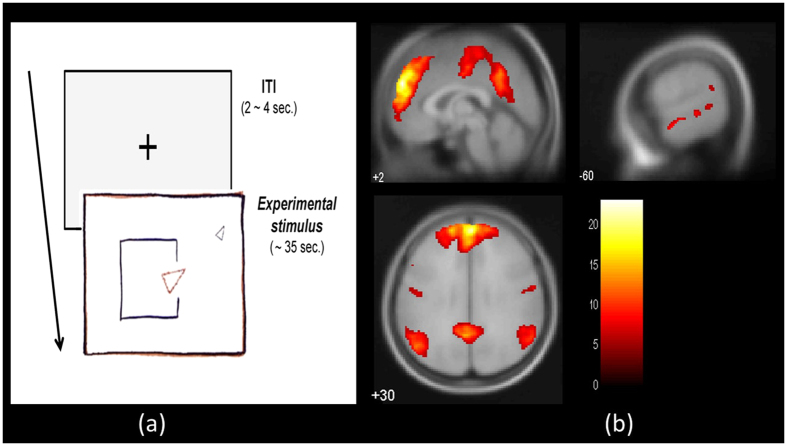
Figure 1. Schematics and results for the Theory of Mind (ToM) localizer task.
(a) Participants watched animations involving two triangles interacting with each other in either a meaningful way (experimental) or in a random manner (control). (b) The ToM network localized at the group level using group independent component analysis (gICA) on the ToM functional localizer task. Regions including the bilateral temporoparietal junction (TPJ), sections of medial prefrontal cortex (mPFC), temporal poles (TP), superior temporal sulcus (STS), and precuneus (PC) formed a functionally connected network. Statistical maps represent t-values thresholded at a voxel-wise threshold of p < 0.05 (FWE-corrected, height threshold: t = 5.62) and extent threshold of 10 voxels. The color bar denotes t-values. A similar network was observed in GLM-based analysis of the data (see Supplementary Text S2). Abbreviation - ITI: intertrial interval.

