
Figure 2. Moral condemnation ratings across conditions.
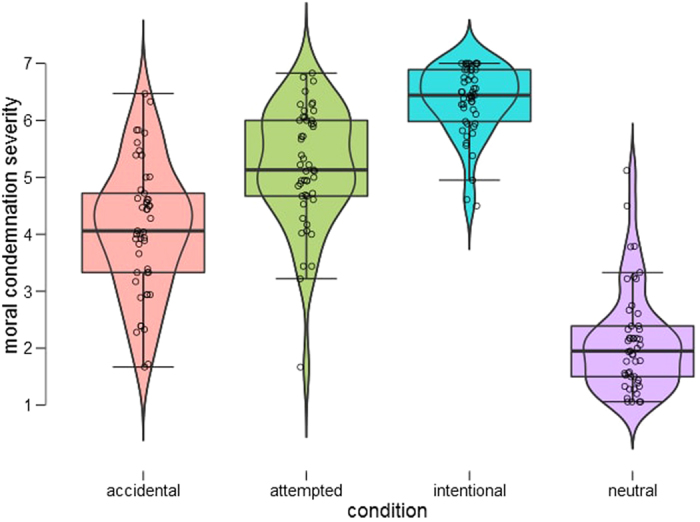
Full distribution of moral condemnation ratings across conditions is shown using combination of box and violin plots96. Box plot within the violin plot contains thick black line for the median and the box indicates the interquartile range, while the added rotated kernel density plot shows the probability density of the data at different values. As can be seen, there was more variation in accidental and attempted harm cases, where intent and outcome was misaligned, as compared to neutral and intentional cases.