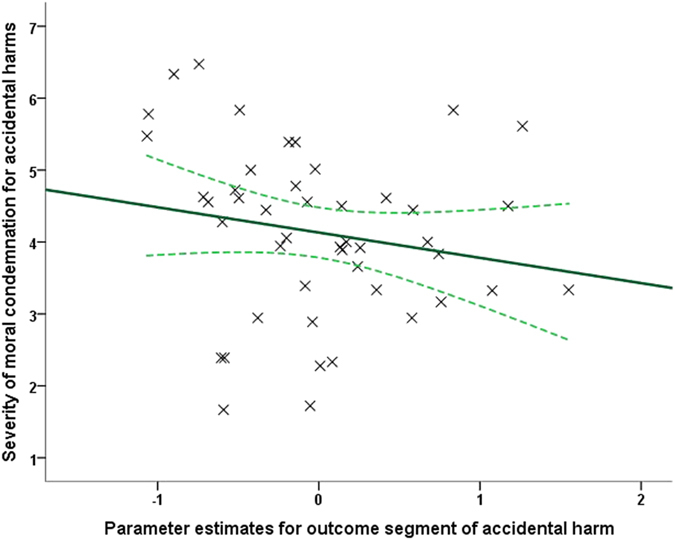
Figure 4. Brain-behavior correlation in fMRI data.

A scatter plot illustrating the negative linear association (ρ(40) = −0.294, p = 0.029, n = 42, one-tailed) between the parameter estimates (βs) extracted from l-aSTS [−60, −12, −12] during the consequence/outcome segment (when outcome information was revealed) of the moral judgment task and the severity of moral condemnation of accidental harms. The solid lines indicate a linear fit to the data, while the curved lines represent mean 95% confidence intervals for this line.
