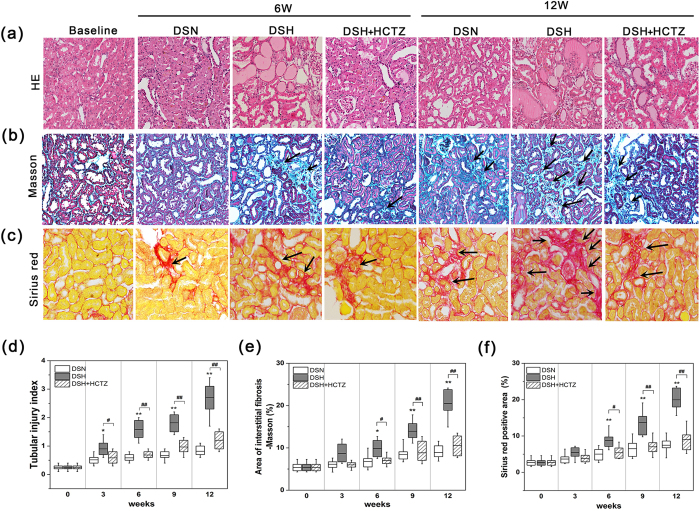
Figure 2. High salt loading induces tubular injury and renal interstitial fibrosis in DS rats.
(a) Representative light microscopy images of hematoxylin-eosin (HE)-stained sections of the renal cortex from each group (magnification, 200X; scale bar = 50 μm). (b) Representative photomicrographs of Masson’s trichrome staining of cortical kidney sections from each group. Fibrosis (black arrows) and fibrotic areas are depicted in the renal cortical sections (magnification, 200X). (c) Representative micrographs of Sirius red-stained renal cortex sections, showing fibrosis (black arrows) and fibrotic areas (magnification, 200X). (d) Graph of the semi-quantitative determination of tubular injury lesions by HE staining. (e) Diagram of the area of Masson staining with renal cortex fibrosis per high-power field (HPF) at each time point. (f) Diagram of the area of Sirius red-positive staining per HPF; this parameter was used to evaluate the fibrotic area in the renal cortex in the long-term experiment. *p < 0.05, **p < 0.01 versus DSN group. #p < 0.05, ##p < 0.01: DSH + HCTZ group versus DSH group.

