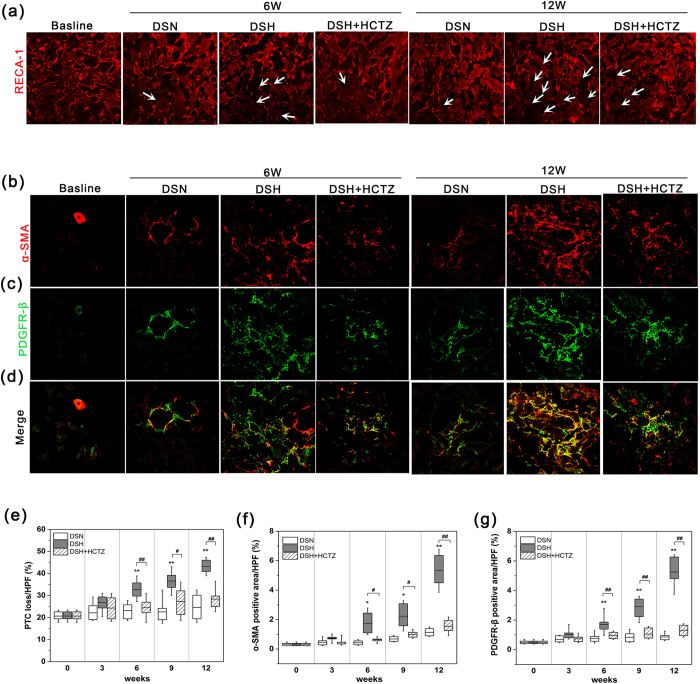
Figure 4. PTC loss and α-SMA accumulation in response to a high salt diet.
(a) Representative images of RECA-labeled PTCs in the renal cortexes of each group; white arrows indicate the loss of PTCs (magnification, 200X). (b–d) Split panel confocal immunofluorescence images of myofibroblasts (red) and mesenchymal cells (green) during the progression of SSHT in DS rats. Composite images of α-SMA and PDGFR-β are shown at the bottom of the panel. Note that most interstitial cells in DS rats fed a high salt diet co-expressed α-SMA and PDGFR-β (magnification, 400X). (e) Graph of the change in the PTC index in the DSH, DSN, and DSH-HCTZ groups at each time point. (f,g) Graphs of the α-SMA- and PDGFR-β-positive areas in the long-term experiment in the DSN, DSH, and DSH + HCTZ groups. *p < 0.05, **p < 0.01 versus DSN group. #p < 0.05, ##p < 0.01: DSH + HCTZ group versus DSH group.

