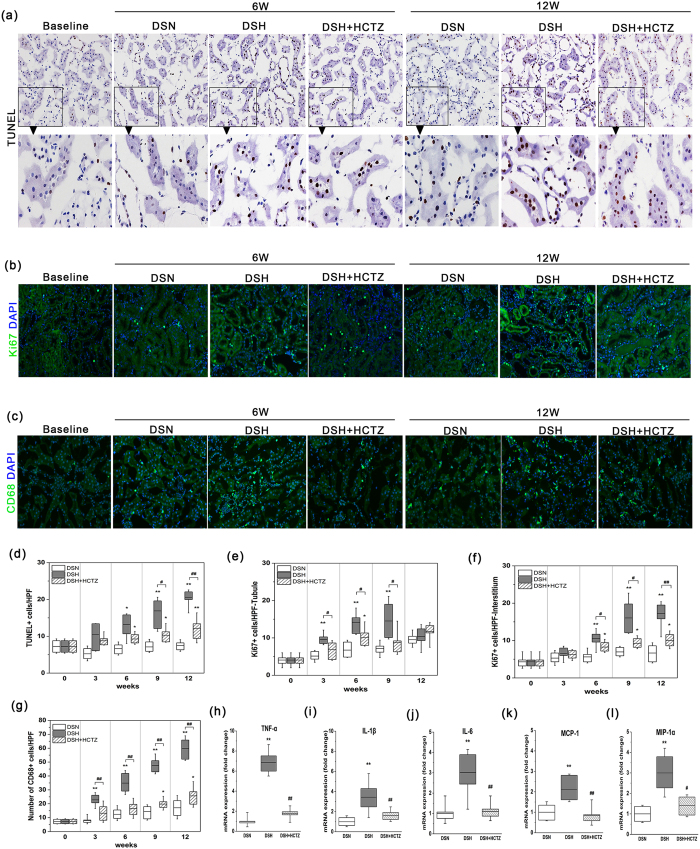
Figure 5. High salt diet induces apoptosis as well as renal tubule and interstitial cell proliferation in DS rats.
Macrophage infiltration and inflammatory cytokine activation in DSH rats. (a) Representative images of TUNEL staining (brown staining) of the three groups at each time point. (magnification, 200X). (b) Immunostaining of Ki67 (green), which indicates renal cell proliferation, in each group (magnification, 200X). (c) Immunofluorescence images of CD68-labeled macrophages in each group at each time point (magnification, 200X). (d) Graph showing the number of TUNEL+ cells per HPF in the renal cortex in each group. (e,f) The chart depicting proliferating cells in the tubules and renal interstitium at each time point. (g) Morphometric quantification of the number of CD68+ cells (green) per HPF as an indicator of the degree of macrophage infiltration. (h–l) Quantitative RT-PCR was used to determine the mRNA levels of inflammatory cytokines and chemokines at the 12-week time point. Relative mRNA expression was determined after normalization to GAPDH, and the data are presented as the fold induction. *p < 0.05, **p < 0.01 versus DSN group. #p < 0.05, ##p < 0.01: DSH + HCTZ group versus DSH group.

