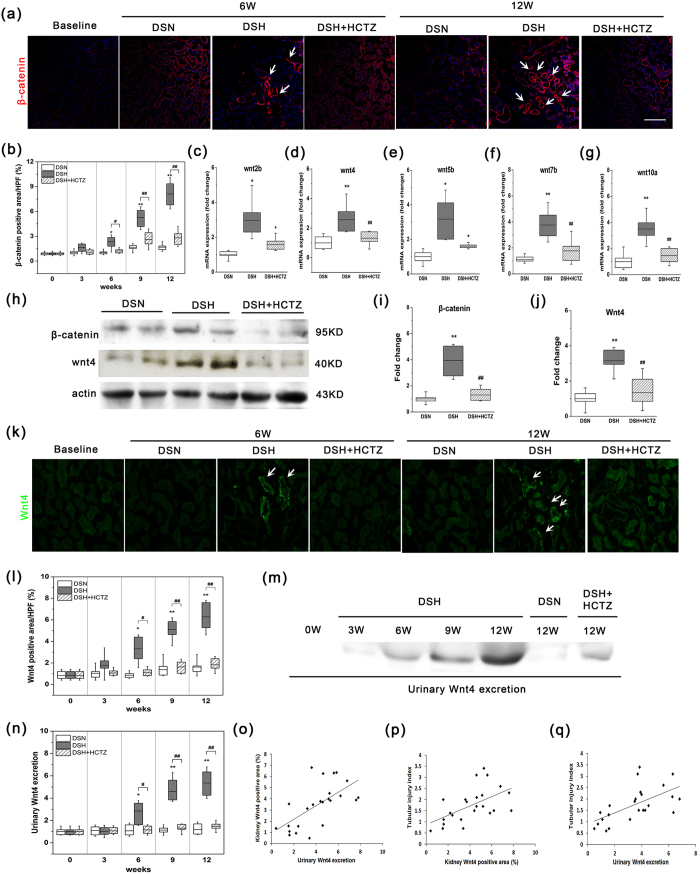
Figure 6. Wnt/β-catenin signaling activation and urinary Wnt4 excretion in DS rats fed a high salt diet.
(a) Representative immunofluorescence micrographs of the time-dependent induction of β-catenin after high salt loading at various time points (magnification, 200X). Arrows indicate β-catenin-positive cells in the interstitium. (b) The chart of the quantification of β-catenin fluorescence intensity. (c–g) Quantitative RT-PCR was used to determine the mRNA levels of β-catenin signaling ligands at the time point with the highest β-catenin expression after high salt loading. Relative mRNA levels were determined after normalization to GAPDH, and the data are presented as the fold induction compared with the DSN group. (h) A dramatic increase in renal β-catenin and Wnt4 expression was observed by western blot analysis. (i–j) The quantitative data are presented, and relative β-catenin and Wnt4 protein levels (fold induction compared with the DSN group) are reported after normalization to β-actin. (k) Representative immunofluorescence micrographs of the time-dependent induction of Wnt4 after high salt loading in each group (magnification, 200X). (l) Quantification of immunofluorescence staining of Wnt4 in each group. (m) Representative western blot analyses of the dynamic changes in urinary Wnt4 expression. (n) Quantification of urinary Wnt4 excretion by western blot analysis in each group. (o) Correlation between kidney Wnt4 expression by immunofluorescence and urinary Wnt4 expression by western blot. (p) Relationship between kidney Wnt4 expression by immunofluorescence and tubular injury index. (q) Correlation between urinary Wnt4 expression by western blot and tubular injury index. The gels were run under the same experimental conditions. Cropped blots are shown (full-sized blots are presented in Supplementary Fig. S1). *p < 0.05, **p < 0.01 versus DSN group. #p < 0.05, ##p < 0.01: DSH + HCTZ group versus DSH group.

