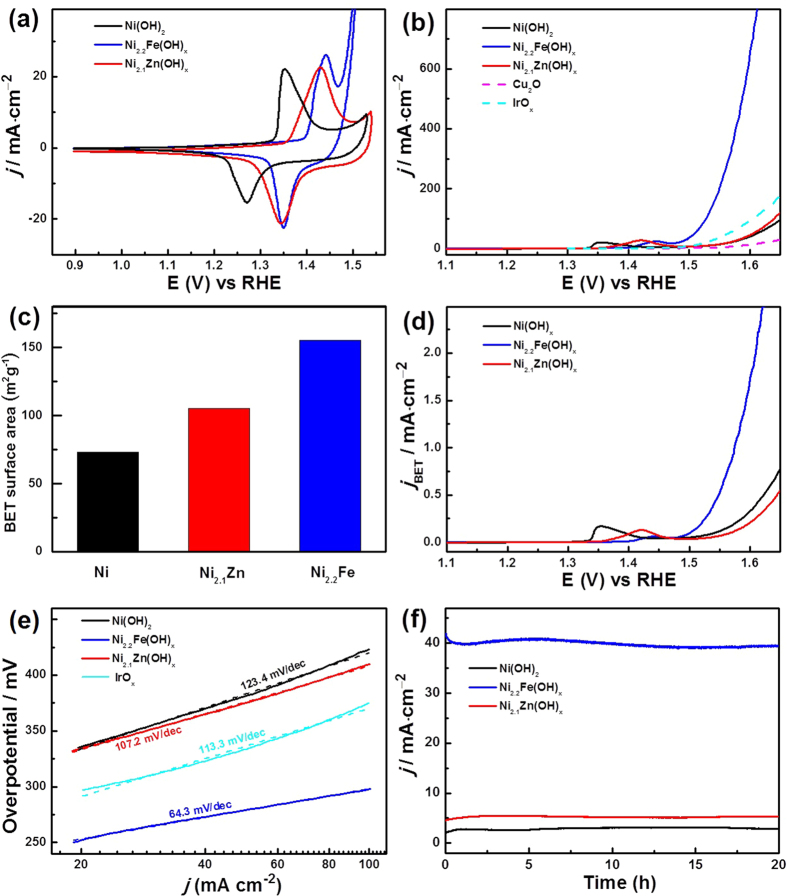
Figure 5.
(a) CV curves of the NiyM(OH)x HNAs. (b) LSV curves of the NiyM(OH)x HNAs, Cu2O nanoarray, and IrOx. (c) BET surface areas (d) LSV curves normalized to the BET surface areas of the NiyM(OH)x HNAs. (e) Tafel plots for the NiyM(OH)x HNAs and IrOx. (f) Chronoamperometric measurements for the NiyM(OH)x HNAs.

