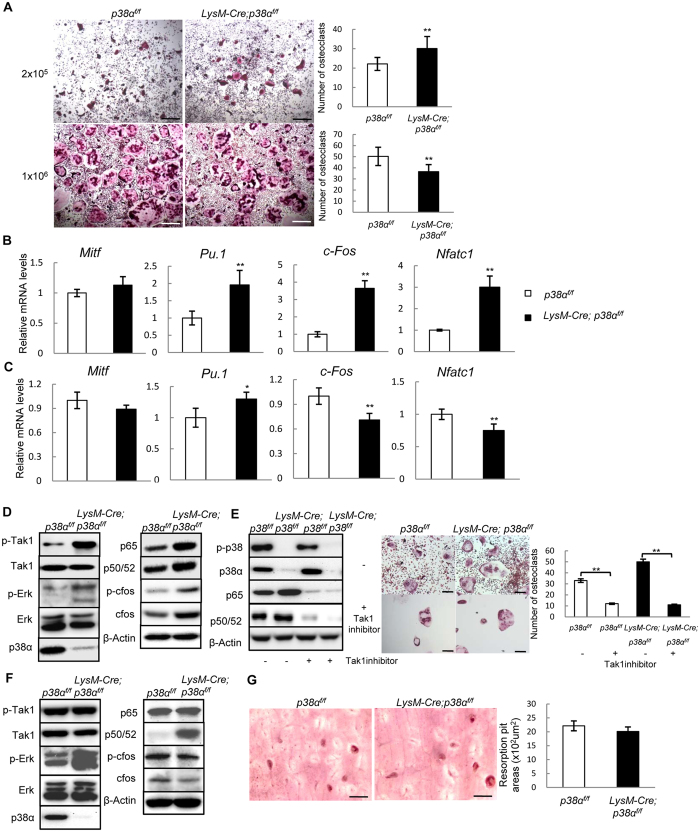
Figure 2. p38α regulated osteoclast differentiation in a cell density-dependent manner.
(A) TRAP staining showed that p38α deficiency promoted osteoclast differentiation in low cell density culture but slightly inhibited osteoclast differentiation in high cell density cultures. Monocytes were isolated from LysM-Cre; p38αf/f and control mice, plated at different densities, and cultured in the presence of RANKL and M-CSF. After 7 days, the cultures were stained for TRAP (left panels). Right panels: quantitation data. Scale bar, 200 μm. N = 3. (B) Quantitative PCR results showed that p38α deficiency promoted the expression of genes required for osteoclast differentiation at low cell densities. Monocytes described in Fig. 2A (low cell density) were collected and used to isolate total RNA, which was used to run quantitative PCR assays. N = 3. (C) Quantitative PCR results showed that p38α deficiency slightly inhibited the expression of genes required for osteoclast differentiation at high cell densities. (D) Western blot results showed that p38α deficient monocytes cultures at low densities exhibited an increase in activation of Tak1 and the protein levels of NF-κB isoforms p50/52 and p65. Scale bar, 100 μm. (E) Inhibition of Tak1 down-regulated NF-κB levels and suppressed osteoclast differentiation. Left panel: western blot showed that Tak1 inhibitor down-regulated NF-κB levels. Middle panel: Tak1 inhibitor suppressed osteoclast differentiation. Right panel: Quantitation data. N = 3. (F) Western blot results revealed that p38α deficient monocyte cultures at high densities showed a decrease in c-Fos protein levels. (G) p38α deficiency did not affect the resorbing activity of osteoclasts on dentine slices. WT and p38 deficient monocytes were induced to differentiate into osteoclasts by M-CSF and RANKL for 2 days and then counted and the same numbers of cells were plated onto dentine slices. After 7 days, the dentine slices were sonicated and stained with Gill’s hematoxylin. Right panel: quantitation data. Scale bar, 200 μm. N = 3. For all results in Fig. 2, P-values are based on Student’s t-test. *p < 0.05, **p < 0.01 when the value of mutant mice or cells was compared to that of control mice or cells, or the drugs-treated group compared to control group.

