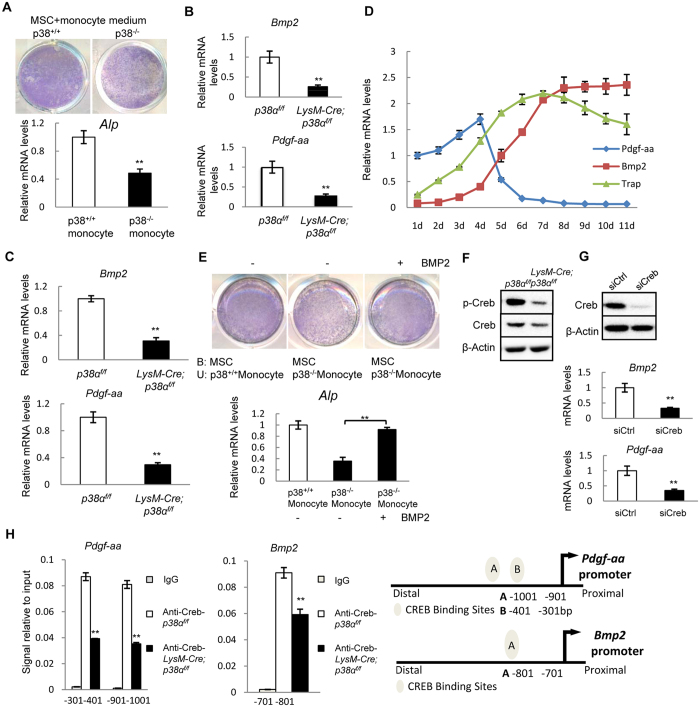
Figure 7. Ablation of p38α in monocytes promoted osteoblastogenesis by promoting BMP2/PDGF-AA synthesis via Creb.
(A) p38α deficient monocyte culture medium showed a reduced activity in supporting osteogenic differentiation of normal MSC cells. Normal MSCs were plated and 24 hrs later, culture medium of WT or p38α deficient monocytes (in the absence of RANKL/M-CSF) was added to the cultures. Four days later, the plates were stained for ALP. Bottom panel: quantitation data of ALP. N = 3. (B) Quantitative PCR results showed that p38α deficient monocytes exhibited a decrease in the mRNA levels of BMP2 and PDGF-AA compared to control cells. N = 3. (C) Quantitative PCR assays revealed that the bone extracts of LysM-Cre; p38αf/f mice showed a decrease in the mRNA levels of PDGF-AA and BMP2 compared to control mice. N = 3. (D) Expression of PDGF-AA, BMP2 and TRAP during osteoclast differentiation. The WT monocytes were induced to differentiate by M-CSF/RANKL. The cells were harvested at different times of induction and total RNA was isolated from these cells, which was used to perform quantitative PCR assays. The basal levels of PDGF-AA mRNA were set at 1.0 and the relative amounts of BMP2 and TRAP were normalized to that of PDGF-AA. (E) Addition of BMP2 to the co-culture system of WT MSCs and p38α deficient monocytes enhanced osteoblast differentiation, justified by ALP staining. Bottom Panel: ALP quantitation data. N = 3. (F) Western blot results show that p38α deficient monocytes displayed a decrease in the levels of p-Creb compared to WT cells. (G) Knockdown of Creb with siRNA led to down-regulation of PDGF-AA and BMP2 expression in normal monocytes. Upper panel: western blot showing the knockdown of Creb. Bottom panel: quantitation data. N = 3. (H) Chromatin-IP experiments showed that PDGF-AA promoter had two Creb binding sites and BMP2 promoter had one Creb binding sites. Right panel: diagrams showing the binding sites of Creb in the promoters of PDGF-AA and BMP2 genes. N = 3. For all results in Fig. 7, P-values are based on Student’s t-test. **p < 0.01 when the mutant mice were compared to control mice, or Creb knockdown cells were compared to the control cells.

