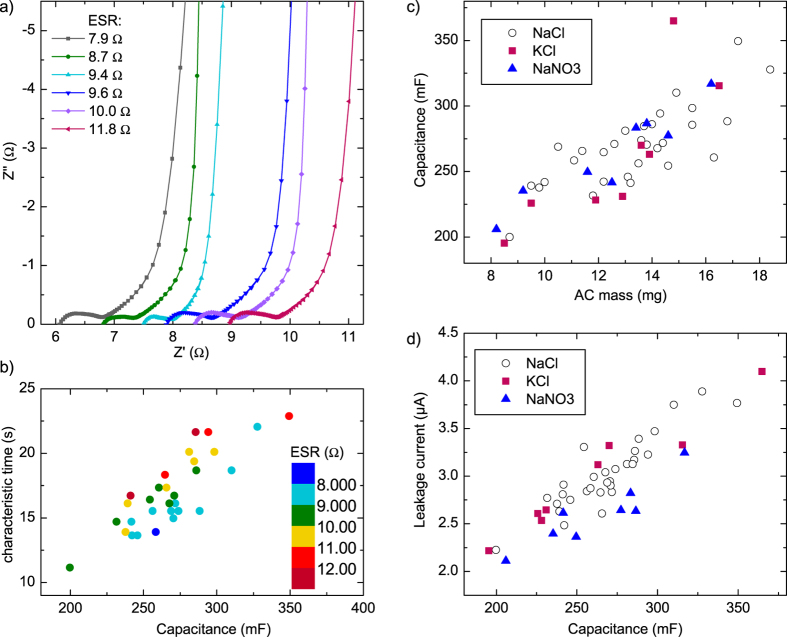
Figure 4.
(a) Nyquist plots of selected samples from approximately 0.2 Hz to the high frequency range. (b) Characteristic time plotted against capacitance with galvanostatically measured ESR as colour scale (colour online). (c) Capacitance versus AC ink mass and (d) leakage current against capacitance for 1 M KCl and NaNO3 samples, compared to NaCl samples (open symbols).

