
Figure 1. Grasp1 KO mice have reduced AMPA mEPSC frequency and dendritic spines.
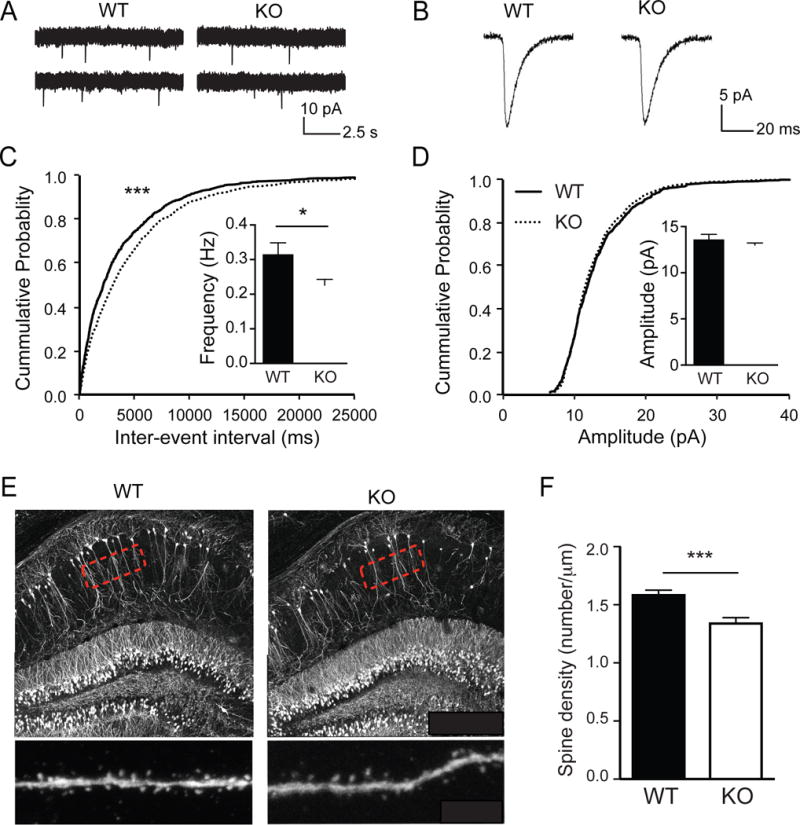
(A) Representative traces of spontaneous mEPSCs recorded from hippocampal CA1 neurons of juvenile Grasp1 mice.
(B) Representative traces of individual mEPSCs.
(C) Quantifications of mEPSC frequency and cumulative distributions of the inter-mEPSC event intervals. mEPSC frequency is lower in Grasp1 KO compared to WT littermates (WT= 0.32 ± 0.03 and KO= 0.23 ± 0.02Hz; n= 18–19 neurons/genotype; p= 0.03, Mann-Whitney test; p< 0.001, Kolmogorov-Smirnov test).
(D) Quantifications of mEPSC amplitude and cumulative distributions of the mEPSC amplitudes. mEPSC amplitudes are comparable between WT and KO littermates (WT= 13.6 ± 0.5 and KO= 13.0 ± 0.2pA, n= 180–19 neurons/genotype; p= 0.28, Mann-Whitney test; p= 0.42, Kolmogorov-Smirnov test).
(E) Representative images of CA1 neurons from Thy1-GFP × Grasp1 mice. High magnification images of secondary dendrites indicated by the highlighted regions were taken for spine number quantifications.
(F) Quantifications of spine density in (E). Spine density is lower in Grasp1 KO compared to WT littermates (WT= 1.50 ± 0.03 and KO= 1.28 ± 0.04, n= 12 neurons/genotype; p < 0.001, unpaired t-test).
All data were presented as mean ± S.E.M. *, p< 0.05; **, p< 0.01, ***, p< 0.001.