
Figure 5. GRASP1 intellectual disability (ID) mutations and their effects on basal-and activity-dependent AMPAR trafficking.
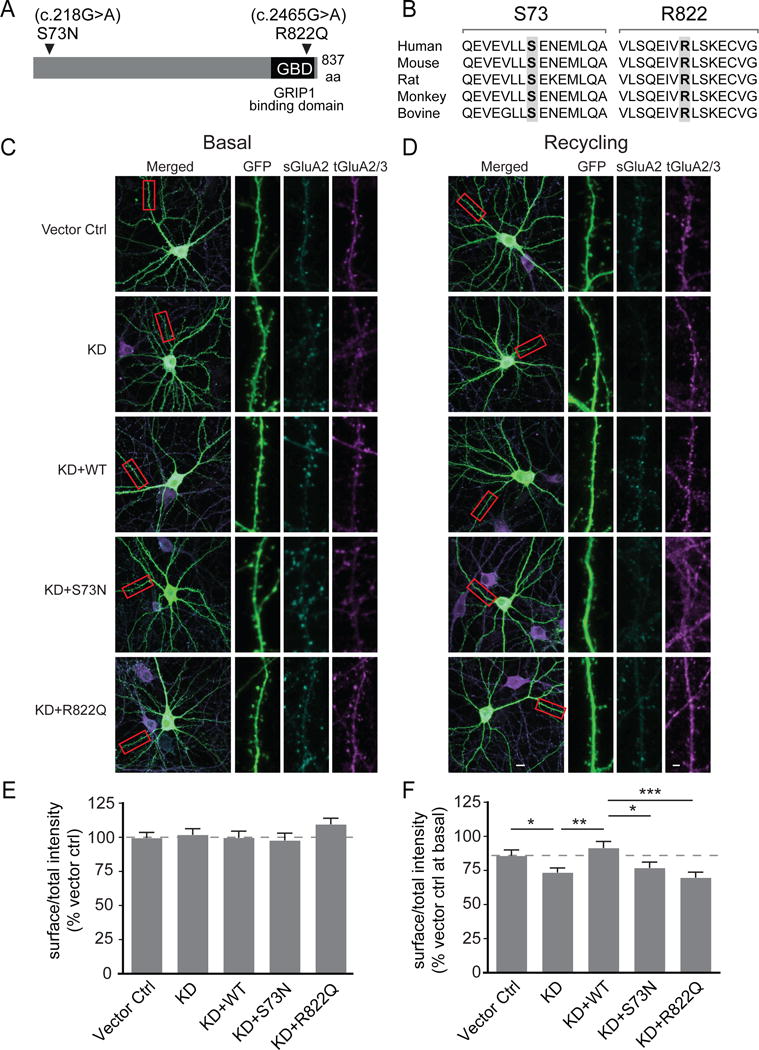
(A) Schematic of GRASP1 protein with a GRIP1 binding domain (GBD) and locations of GRASP1 mutations found in severe ID patients.
(B) Sequence alignments of GRASP1 flanking the ID mutations.
(C) Representative images of rat hippocampal neurons and dendritic segments transfected with GFP and a control vector (Vector ctrl), shRNA for GRASP1 protein knockdown (KD), or KD plus either GRASP1 WT, S73N, or R822Q with mock treatment. A highlighted dendritic region (red box) is shown at higher magnification with separate channels to show GFP, surface GluA2 (sGluA2) and total GluA2/3 (tGluA2/3) staining.
(D) Same as (C) except that neurons were AMPA-treated to induce AMPAR recycling.
(E) Quantifications of (C). Integrated intensity of sGluA2, normalized to tGluA2/3 signal, is comparable between all groups. (% Vector control: Vector ctrl= 99.9 ± 4.3; KD= 102.8 ± 4.5; KD+WT= 100.1 ± 4.8; KD+S73N= 98.2 ± 5.4; KD+R822Q= 110.0 ± 4.6; n= 84–96 dendrites from 21–24 neurons/group; p>0.05; one-way ANOVA).
(F) Quantifications of (D). Integrated intensity of s/tGluA2(3) were normalized to vector ctrl at basal state to quantify AMPA-induced AMPAR recycling. (% Vector ctrl at basal: Vector ctrl= 86.4 ± 4.2 and KD= 74.0 ± 3.3, p= 0.04; KD+WT= 92.1 ± 4.8 and KD, p=0.002; KD+WT and KD+S73N= 77.4 ± 4.2, p=0.015; KD+WT and KD+R822Q= 70.3 ± 4.1, p=0.0002; n= 88–100 dendrites from 22–25 neurons/group; one-way ANOVA).