
Fig. 7. GST pulldown and analytical ultracentrifugation (AUC) experiments characterizing interaction between eIF3c-NTD, eIF1 and eIF5.
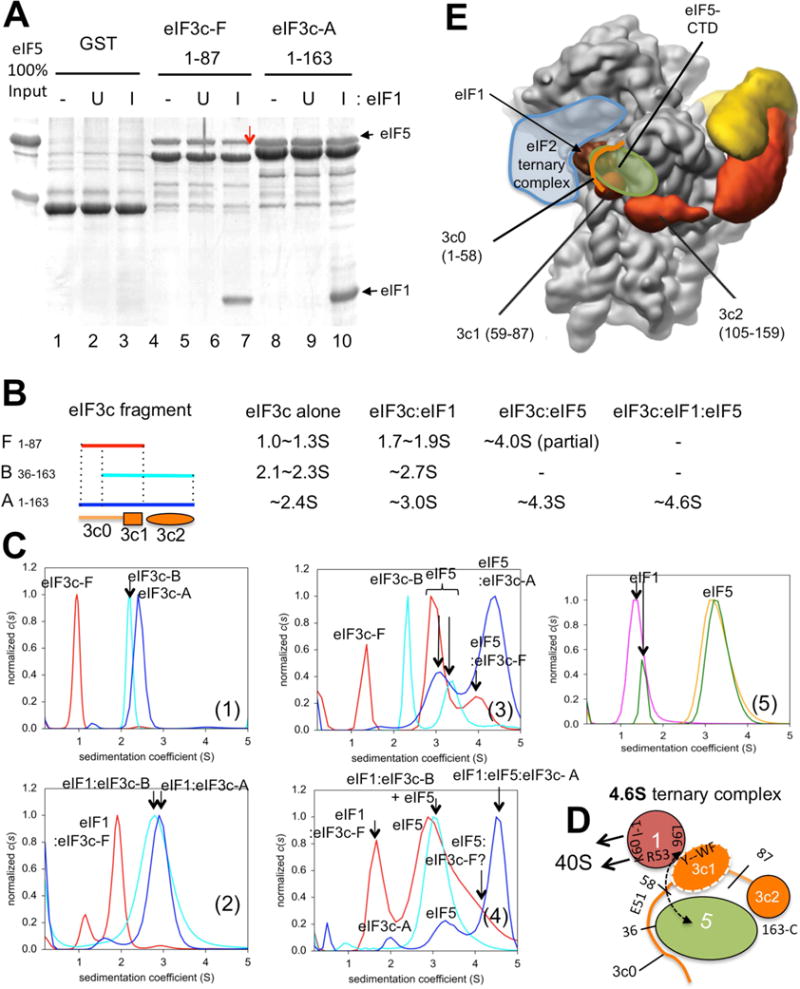
(A) GST pulldown assay demonstrating inhibition of eIF5 binding to eIF3c by excess eIF1. ~5 μg of indicated GST-eIF3c fusion proteins (~0. 2 nmol) were allowed to bind ~5 μg of eIF5 (~0. 1 nmol) in the presence of 70 μg of recombinant eIF1 (~5 nmol) present in induced (I) lysates and the complex analyzed by SDS-PAGE and Commassie staining. U and -, uninduced lysate or buffer, respectively, was added in place of induced lysates. (B) Summary of AUC interaction studies. Left, eIF3c-NTD fragments used are shown with bars indicating their relative locations in eIF3c primary structure. Second, third, forth and fifth columns list sizes of eIF3c species or complexes formed. -, no complex formation. (C) AUC analysis. The sedimentation coefficient (c(s)) distributions of reactions containing eIF3c-F (red), -B (cyan) and -A (blue), either alone (panel 1) or in the presence of eIF1 (panel 2), eIF5 (panel 3) or both (panel 4). Panel 5, eIF1 (pink), eIF5 (orange) and the mixture thereof (green). Proposed peak assignments are presented for each experiment. (D) Schematic illustration of the proposed 4. 6S trimeric complex. eIF3c-NTD is drawn as blue orange line representing unstructured segments, 3c0 (aa. 1–58), and orange circles representing 3c1 (aa. 59–87) and 3c2 (aa. 105–159), as found in cryo-EM models in Fig. 2 and redefined based on 15N-eIF3c-B CSP studies (Fig. 3). eIF5 (dark green circle) is depicted as contacting both ends of eIF3c-NTD. eIF1 (brown circle) is bound to 3c1 via R53 and L96 (labeled). K60 and loop-1 (l-1) of eIF1 are open for 40S binding (arrows). E51, showing CSP with eIF1; Y--WF; Y70, W74, F75, showing line broadening with eIF1 (Fig. 1E and S3). Numbers along eIF3c schematics indicate boundaries of eIF3c units. Dotted arrow indicates the interaction between eIF1-L96 and eIF5, suggested here to stabilize the trimeric complex, as it does in the scanning PIC (Luna et al., 2012; Reibarkh et al., 2008). (E) Locations of eIF2 ternary complex (blue drawing) (Llacer et al., 2015), eIF5-CTD (dark green circle, this study) and 3c0 (aa. 1–58) (orange line, this study) are superimposed onto the re-calculated cryo-EM structure, as shown in Fig. 2B, right. See also Figure S8 and Table S1.