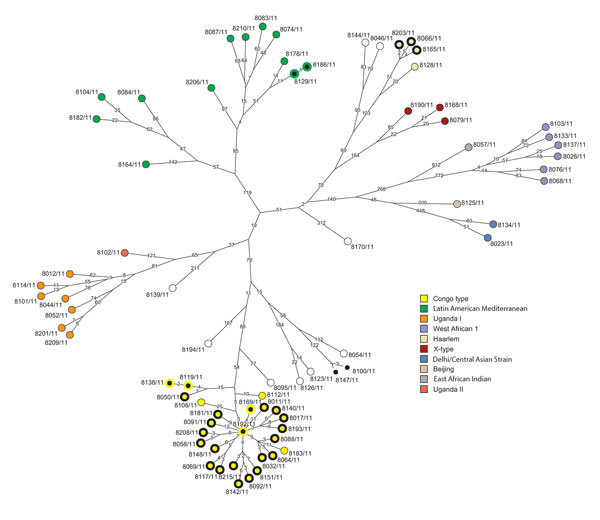
Figure 2.

Maximum parsimony tree of Mycobacterium tuberculosis complex isolates from Congo. The tree was calculated on the basis of the concatenated single-nucleotide polymorphism (SNP) list. Branch labels indicate SNP distances; node labels represent the strain identifiers. Clusters based on pairwise comparisons were plotted on the tree: clusters <5 SNPs, nodes filled in black; clusters <12 SNPs, nodes with bold black outlines.
