
Figure 2.
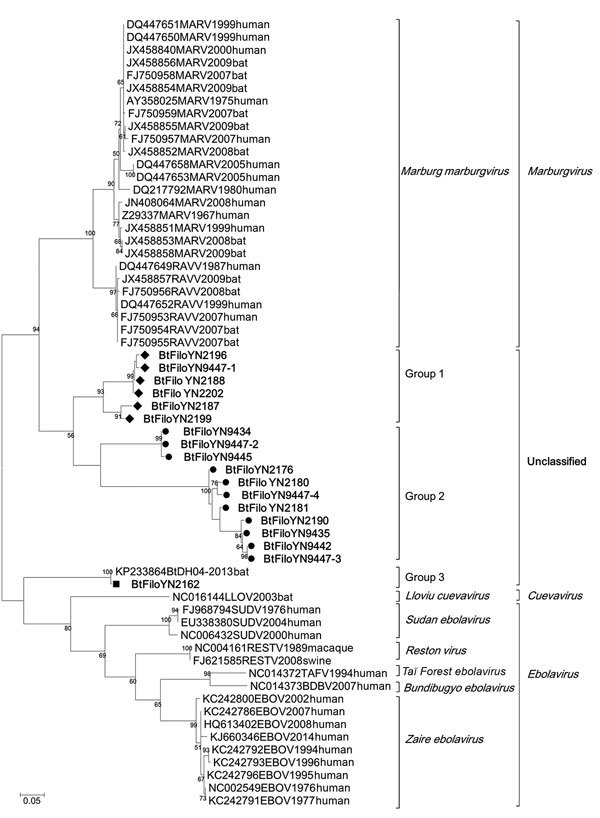
Phylogenetic analysis of filovirus isolates collected in study of genetically diverse filoviruses in Rousettus and Eonycteris spp. bats in China, compared with reference isolates. Analysis was based on a 310-bp segment of the filovirus L gene. Bootstrap values lower than 50 are not shown. The maximum-likelihood tree was constructed based on the 310-bp segment with 1,000 bootstrap replicates. The sequences obtained in this study are marked with a triangle (group 1), black dot (group 2), or rectangle [group 3). Sequences from GenBank are listed by their accession numbers, followed by the virus name, collection year, and host. Scale bar indicates nucleotide substitutions per site.