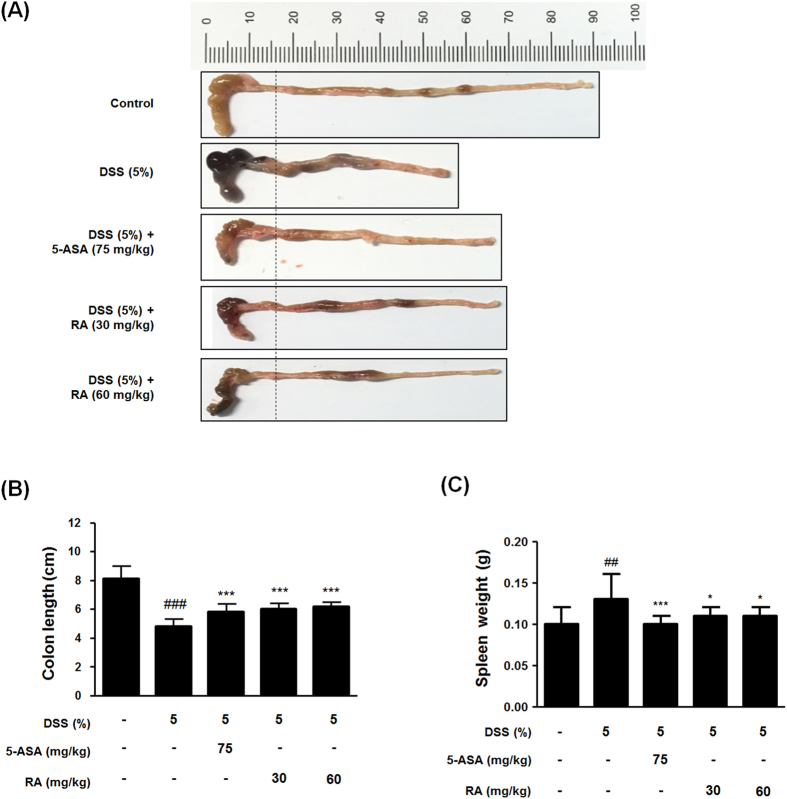
Figure 2. Effect of RA on the symptom of DSS-induced colitis model.
(A) A representative photograph of colon tissues in each group is provided. (B) The colon length was measured when mice were euthanized. (C) Spleen weight was measured in each mouse. Values are the mean ± SD (n = 10); ##P < 0.01, ###P < 0.001 vs control group; *P < 0.05, ***P < 0.001 vs the DSS-induced group; significances between treated groups were determined using ANOVA and Dunnett’s post hoc test.

