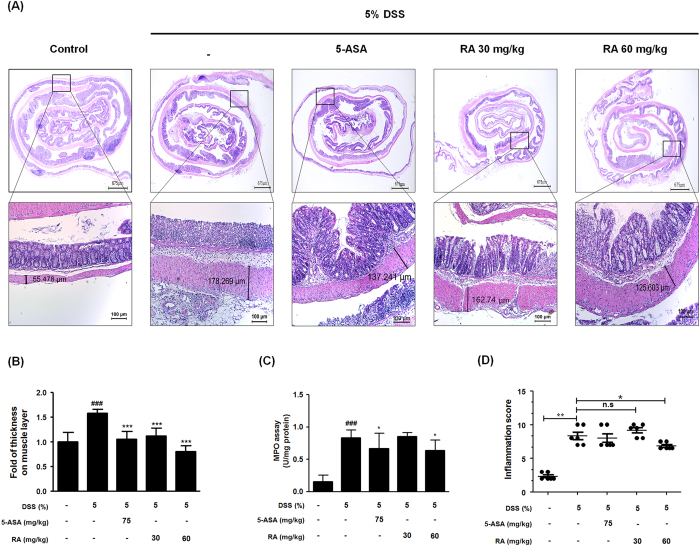
Figure 3. Histological estimation of colorectal tissues and MPO activity.
(A) Representative portion of colon tissues were stained by H&E. (B) Muscle thickness of colon sections were evaluated using LAS software. Stained section was observed by microscope. Magnification x40, x100 inset. (C) MPO level in colon tissues was determined. (D) Inflammation score in DSS-induced mice was estimated. Values are the mean ± SD (n = 10); ###P < 0.001 vs control group; *P < 0.05, ***P < 0.001 vs the DSS-induced group; significances between treated groups were determined using ANOVA and Dunnett’s post hoc test.

