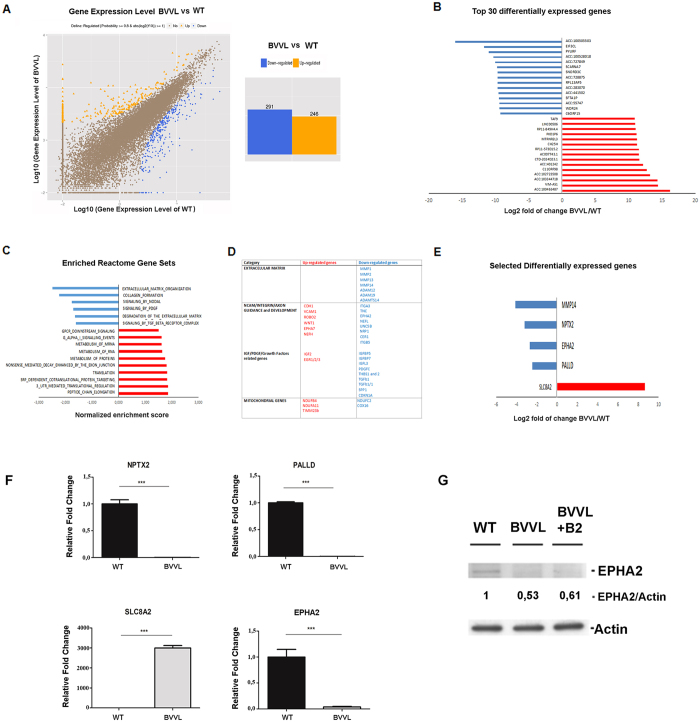
Figure 2. Transcriptional analysis of BVVL-MNs vs WT-MNs by RNA-seq analysis shows dysregulation of specific mRNA subsets.
(A) Left: Graphical representation of the transcriptomic analysis of differentially expressed genes among BVVL-MNs vs WT-MNs. Right: A total of 537 differentially expressed genes (fold change ≥2 and diverge probability ≥0.8) were observed in BVVL-MNs compared to WT-MNs; 246 were up-regulated, and 291 were down-regulated in BVVL-MNs. (B) Top 30 genes (based on fold change) misregulated in BVVL-MNs vs WT-MNs with an FDR 5%. (C) Selected gene sets obtained using the GSEA algorithm. Gene sets that were enriched in BVVL-MNs include terms related to protein and RNA metabolism, while depleted genes were associated with the extracellular matrix and growth factors. (D) Reactome gene categories and selected genes dysregulated in BVVL-MNs. (E,F) Comparison between RNA-seq (E) and quantitative RT-PCR (F) data for a select number of transcripts involved in neurite outgrowth and axon guidance in BVVL-MNs with respect to WT-MNs. Error bars represent SEM. ***P < 0.001; **P < 0.001, *P < 0.05. (G) Western blot analysis of EPHA2 in BVVL and WT-MNs showing a reduced protein level in diseased cells, without significant modifications after riboflavin treatment. Numbers indicate protein levels normalized to actin.

