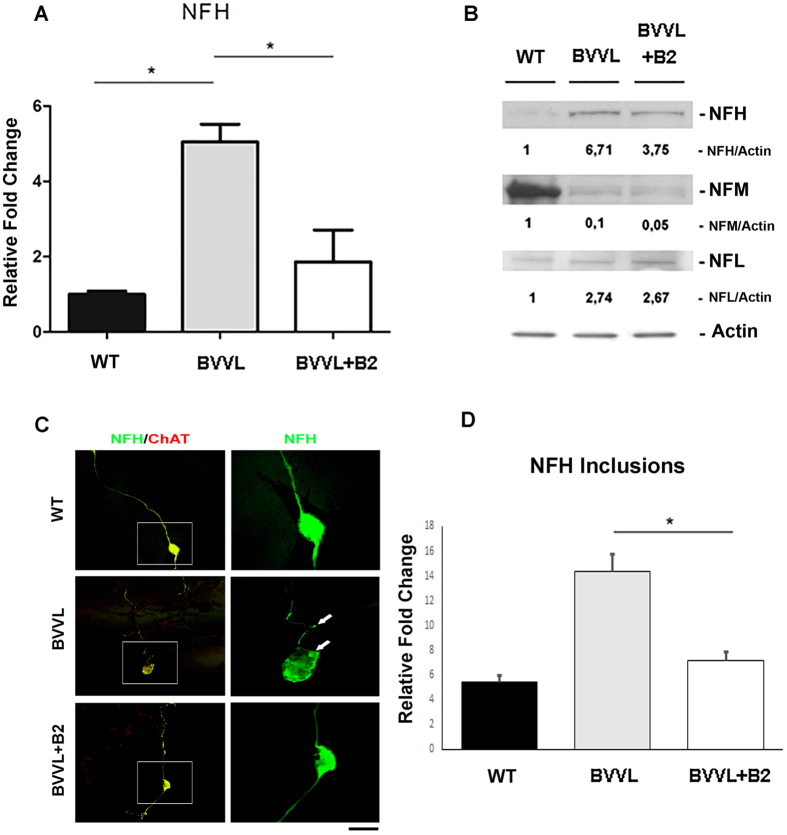
Figure 4. Neurofilament expression pattern is altered in BVVL MNs and is rescued by riboflavin treatment.
(A) Real-time RT-PCR showed the up-regulation of NFH mRNA in BVVL-MNs vs WT-MNs. This upregulation was significantly reduced in BVVL-MNs+B2. Error bars represent SEM. *P < 0.05. (B) Western blot analysis of NFH (200), NFM (medium) (168), and NFL (light) (68) in BVVL-MNs with respect to WT-MNs and BVVL-MNs+B2. Numbers indicate protein levels normalized to actin. NFH was upregulated in BVVL-MNs relative to WT-MNs. This up-regulation was reduced after B2 treatment. The expression level of NEFM and NEFL was imbalanced respect to NFH. (C) Immunofluorescent images of NFH (green) and ChAT+ (red) in WT-MNs, BVVL-MNs and BVVL-MNs+B2. NFH inclusions (green) were observed in the cell body and in neurites of BVVL-MNs. This feature was ameliorated by B2 treatment. (D) Quantification of NFH inclusion–containing in cell bodies and neuritis in WT-MNs, BVVL-MNs and BVVL-MNs+B2. Error bars represent SEM. *P < 0.05. Scale bar: 75 μm.

