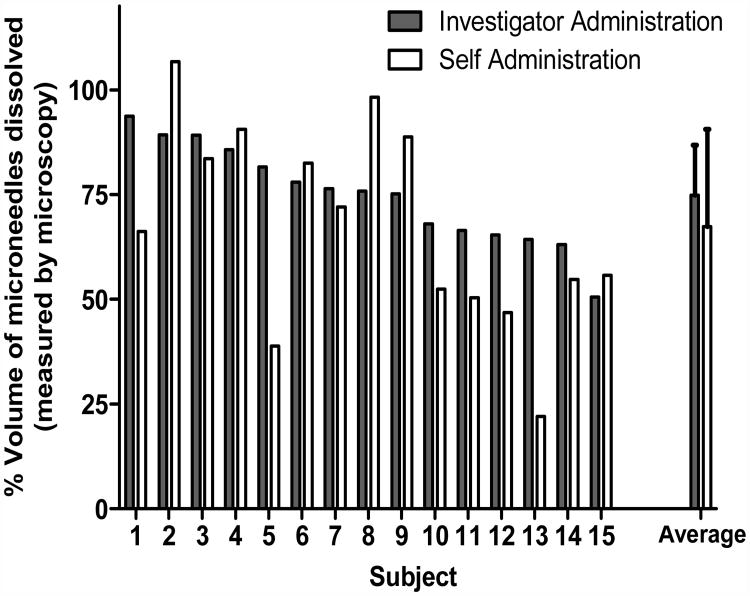
Figure 5.
Delivery efficiency as determined by the percentage of the volume of microneedles that dissolved during microneedle patch application to the skin. Microneedle patches were imaged by brightfield microscopy before and after insertion into the skin and image analysis was used to determine the volume of microneedles dissolved. (a) Volume of microneedles dissolved is interpreted as a measure of the dose delivered, i.e., if a drug or vaccine had been incorporated into the full volume of the microneedles. Each bar represents the result from an individual subject. The data are presented in descending order of investigator-administered delivery efficiency. The ‘average’ bars represent the averages of the 15 individual bars, with standard deviation error bars shown. (b) Percent of subjects that delivered more than 50% of the volume of the microneedles.

