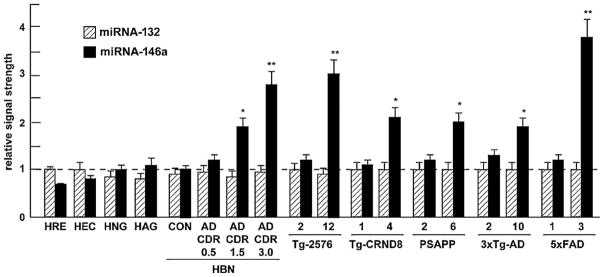
Fig. 2.
Relative signal strength of miRNA-146a in comparison to a lower abundance miRNA-132 in various human primary brain and retinal primary cells, control (N = 6) and Alzheimer-affected (N = 6 for each CDR rating) neocortex, and in 5 different transgenic mouse models of Alzheimer’s disease (Tg-AD). In the Tg-AD models, two ages of animals are given, the first is a younger animal with no neuropathology and the second is after the onset of neuropathology (Table 1). Only the Tg-2576 and 5xFAD Tg-AD models showed miRNA-146a induction of 3-fold or greater over controls. HRE, human retina, HEC, human brain microvessel endothelial cells, HAG, human astroglia, HBN, human brain neocortex; CON, control; AD, Alzheimer’s disease, CDR, clinical dementia rating; see Table 1 for further description of the Tg-AD; time in months (mo); N = 3–6 animals for each determination; for ease of comparison control (CON) miRNA-146a levels arbitrarily set to 1.0; dashed horizontal line;*p < 0.05, **p < 0.01 (ANOVA).

