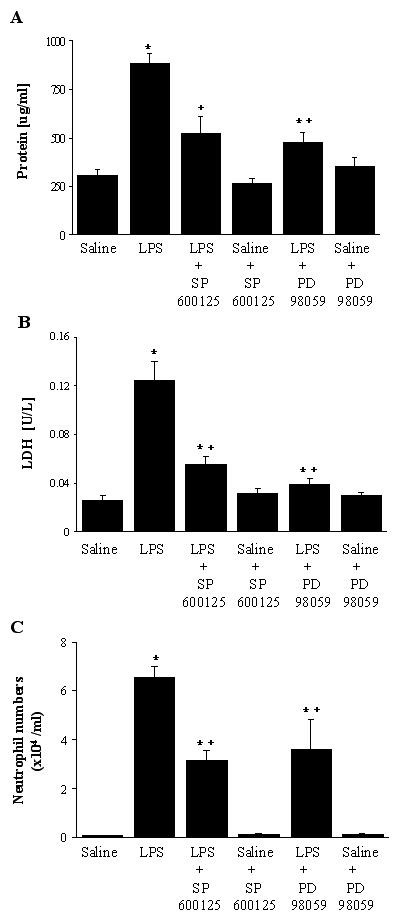
Figure 3.

Levels of total protein (A), activity of LDH (B) and neutrophil numbers (C) in bronchoalveolar lavage fluid. The groups represent rats treated as follows: Saline, saline (IT); LPS, LPS (IT); LPS-SP600125, LPS (IT) and a pretreatment with SP600125 (IO), Saline-SP600125, saline (IT) and a pretreatment with SP600125 (IO);LPS-PD98059, LPS (IT) and a pretreatment with PD98059 (IO), Saline-PD98059, saline (IT) and a pretreatment with PD98059 (IO). Animals were sacrificed 4 hours after LPS treatment. Values represent means ± SEM of results from 5 rats in each group. * Significant differences between saline, p < 0.05, and + significant difference compared with LPS group, p < 0.05.
