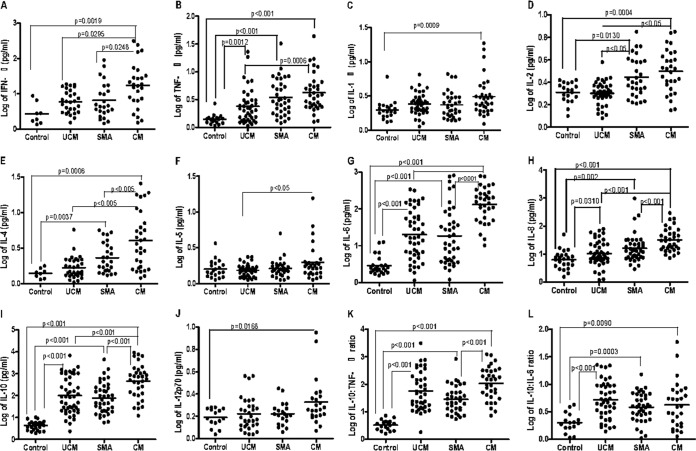
FIG 1.
(A to J) Plots of log-transformed concentrations (picograms per milliliter) of different cytokines (IFN-γ, TNF-α, IL-1β, IL-2, IL-4, IL-5, IL-6, IL-8, IL-10, and IL-12p70) in serum samples collected from healthy controls (Control) and from patients with acute uncomplicated malaria (UCM), acute severe malarial anemia (SMA), and acute cerebral malaria (CM). (K and L) Plots of the ratios of log-transformed IL-10 to TNF-α and IL-10 to IL-6, respectively, during acute infection, showing medians and 10th and 90th percentiles.

