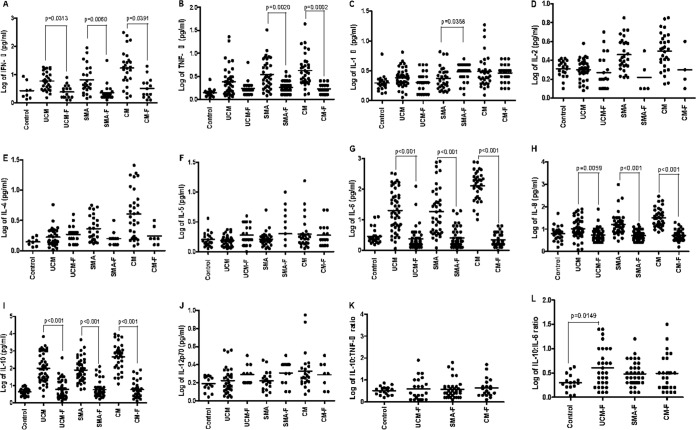
FIG 2.
(A to J) Plots of log-transformed concentrations (in picograms per milliliter) of different cytokines (IFN-γ, TNF-α, IL-1β, IL-2, IL-4, IL-5, IL-6, IL-8, IL-10, and IL-12p70) in serum samples collected from healthy controls (Control) and from patients with convalescent uncomplicated malaria (UCM-F), severe malarial anemia (SMA-F), and cerebral malaria (CM-F). (K and L) Plots of the ratios of log-transformed IL-10 to TNF-α and IL-10 to IL-6, respectively, during convalescence, showing medians and 10th and 90th percentiles.

